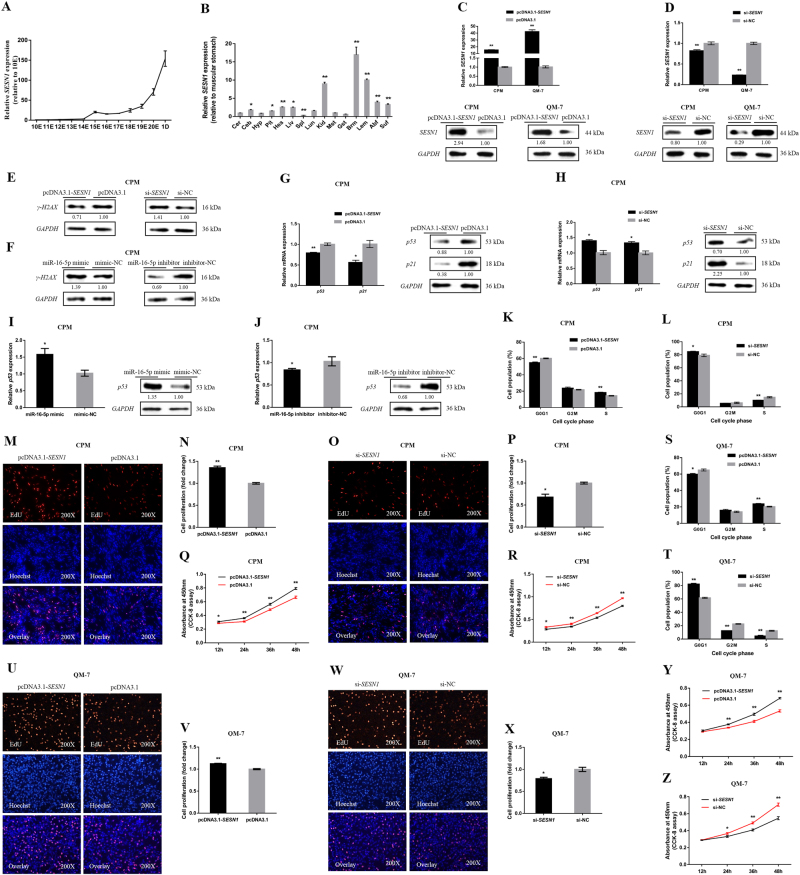
Fig. 5. SESN1 facilitates myoblast proliferation via the p53 signaling pathway.
a The relative mRNA expression of SESN1 in chicken embryonic breast muscle. b Xinghua (XH) chicken tissue expression profiles of SESN1. The horizontal axis and vertical axis indicate different tissues and their relative expression values, respectively (mean ± S.E.M). Cer cerebrum, Ceb cerebellum, Hyp hypothalamus, Pit pituitary, Hea heart, Liv liver, Spl spleen, Lun lung, Kid kidney, Mst muscular stomach, Gst glandular stomach, Brm breast muscle, Lem leg muscle, Abf abdominal fat, and Suf subcutaneous fat. c, d The mRNA and protein expression levels of SESN1 with SESN1 overexpression and knockdown in CPMs and QM-7 cells. The numbers shown below bands were folds of band intensities relative to control. Band intensities were quantified by ImageJ and normalized to GAPDH. Data are expressed as a fold change relative to the control. e, f Western blotting analysis of γ-H2AX protein levels after SESN1 (e) and miR-16-5p (f) overexpression and knockdown in CPMs. The numbers shown below bands were folds of band intensities relative to control. Band intensities were quantified by ImageJ and normalized to GAPDH. Data are expressed as a fold change relative to the control. g, h The mRNA and protein expression levels of p53 and p21 after transfection of pcDNA3.1-SESN1 and si-SESN1 in CPMs. The numbers shown below bands were folds of band intensities relative to control. Band intensities were quantified by ImageJ and normalized to GAPDH. Data are expressed as a fold change relative to the control. i, j The mRNA and protein expression levels of p53 after overexpression and inhibition of miR-16-5p in CPMs. The numbers shown below bands were folds of band intensities relative to control. Band intensities were quantified by ImageJ and normalized to GAPDH. Data are expressed as a fold change relative to the control. k, l Cell cycle analysis of CPMs after SESN1 overexpression and knockdown. m, o EdU proliferation assays for CPMs with overexpression and inhibition of SESN1. n, p The numbers of proliferative cells were also counted. q, r CPMs growth curves following transfection of pcDNA3.1-SESN1 and si-SESN1. s, t QM-7 cells were collected for cell cycle analysis 48 h after transfection. u, w EdU proliferation assays for QM-7 cells with overexpression and inhibition of SESN1, v, x the numbers of proliferative cells were also counted. y, z QM-7 cells growth curves following transfection of pcDNA3.1-SESN1 and si-SESN1. In all panels, results are expressed as mean ± S.E.M. of three replicates. Statistical significance of differences between means was assessed using an unpaired Student’s t-test (*P < 0.05; **P < 0.01) vs. NC, negative control

