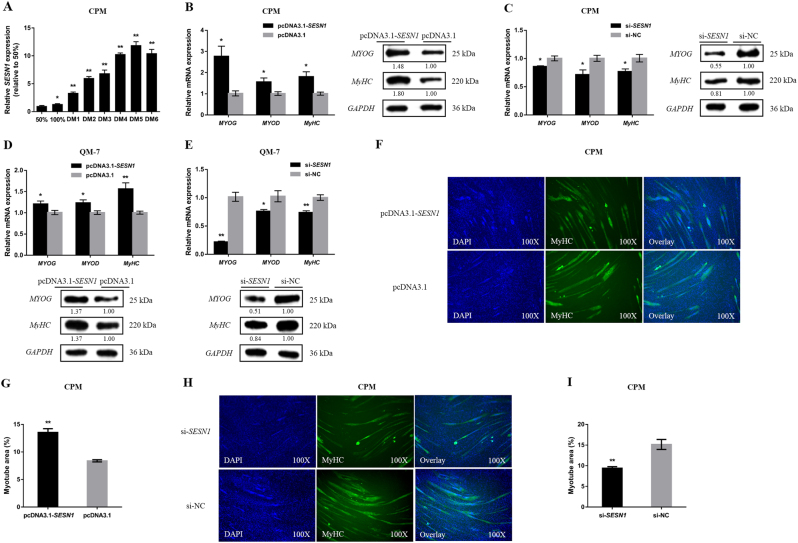
Fig. 7. SESN1 promotes myoblast differentiation.
a The relative mRNA expression level of SESN1 during CPM differentiation. b–e Both in CPMs and QM-7 cells, the mRNA and protein expression levels of myoblast differentiation marker genes with transfection of pcDNA3.1-SESN1 and si-SESN1 were detected. The numbers shown below bands were folds of band intensities relative to control. Band intensities were quantified by ImageJ and normalized to GAPDH. Data are expressed as a fold change relative to the control. f, h Immunofluorescence analysis of MyHC-staining cells after pcDNA3.1-SESN1 (f) and si-SESN1 (h) transfection into CPMs. g, i Myotube area (%) of CPMs with SESN1 overexpression and knockdown. In all panels, results are expressed as the mean ± S.E.M. of three biological replicates. Statistical significance of differences between means was assessed using an unpaired Student’s t-test (*P < 0.05; **P < 0.01) vs. NC, negative control

