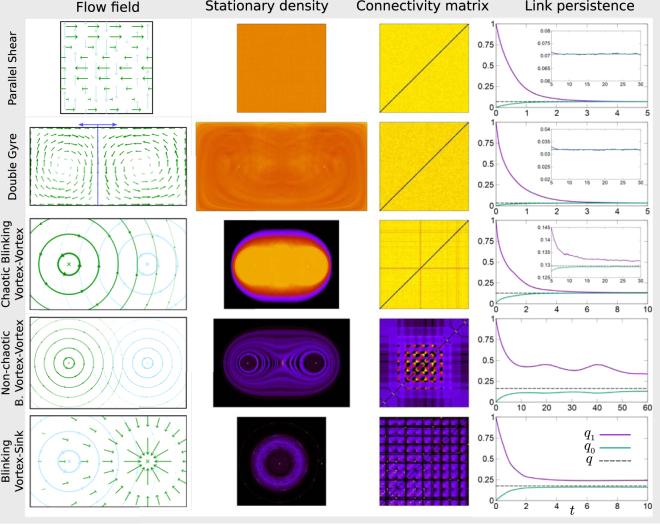
Figure 2.
Mixing properties of different planar flows. The first column shows a graphical representation of the flow field for a selection of two-dimensional flows (see Supplemental Material). Velocity fields are periodic (modulo a random phase), and we use a period of one throughout. Green and blue arrows represent this periodic switching. The second column shows the stationary density of particles in space, as measured from simulations. The fraction of time each pair of particles spend within interaction radius from each other is shown as a connectivity matrix in the third column. Results are from simulations. The fourth column shows the measured link persistence, q1(t), as well as q0(t) and the asymptotic connectivity q (see text). Convergence of q1 and q0 to a common value q indicates that the flow mixes the system.

