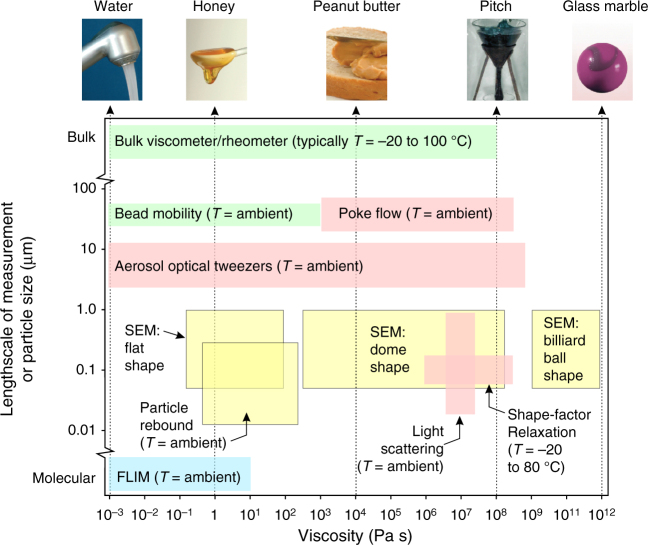
Fig. 2.
Size and viscosity ranges of techniques used to measure the viscosity of aerosol particles. Techniques dependent on resistance to an applied force, coalescence and shape relaxation, impaction on substrates or the use of molecular fluorescence probes are indicated by green, red, yellow and blue boxes, respectively. Where relevant, the temperature (T) range accessible to the technique is indicated. The top row indicates substances that have a viscosity typical of the value identified by the arrow from the bottom axis. SEM indicates the use of scanning electron microscopy and FLIM is fluorescence lifetime imaging microscopy. (Reproduced in part from ref. 7 with permission from the Royal Society of Chemistry)

