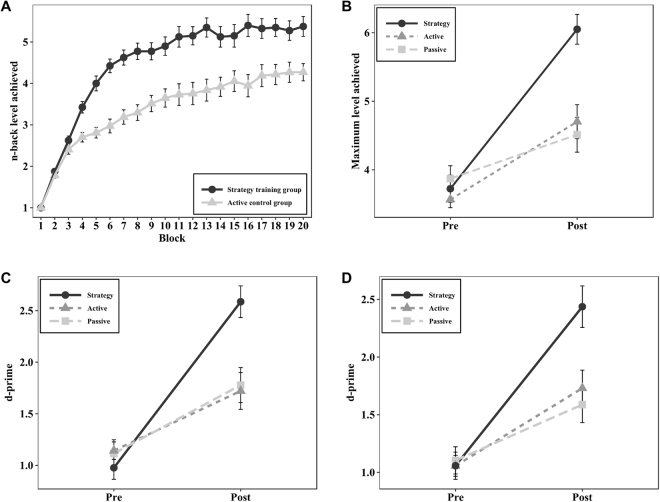
Figure 1.
(A) Training data across the 20 training blocks. The Y-axis represents the n-back level reached. Error bars represent standard error of means. The strategy training group reached a higher n-back level already on the fourth training block (p < 0.001). (B) Pre- and posttest performance in the trained n-back task with maximum n-back level achieved as the outcome variable. The strategy training group showed a significant improvement in the trained task as compared to the active control group (p < 0.001) and the passive control group (p < 0.001). (C) shows pre- and posttest performance in the 3-back task with letters, and (D) depicts the corresponding results for the 3-back task with colors. In both tasks, the dependent variable was d-prime. Both untrained 3-back tasks showed significant improvement in the strategy training group, compared with the active control group (p = 0.001) and the passive control group (p < 0.001).

