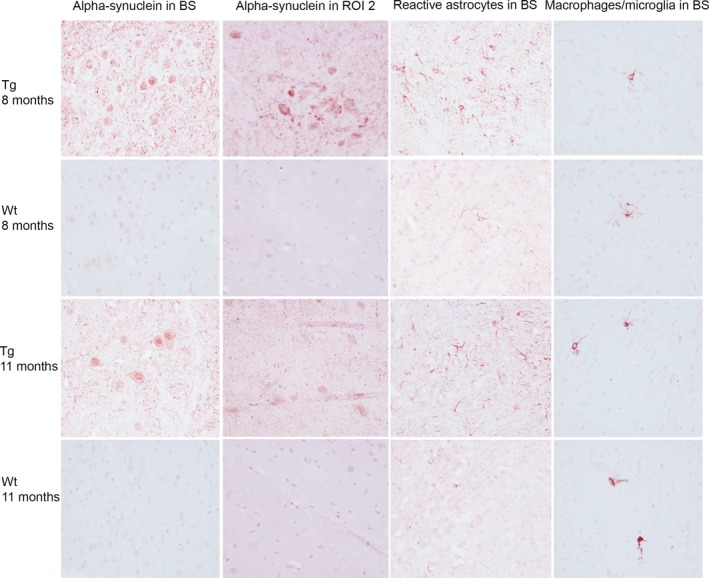
Figure 6.

Immunohistochemical staining of α‐syn (mAb38F), astrocytes (GFAP), and activated macrophages/microglia (Mac‐2) in 8‐ (n = 3) and 11 (n = 3)‐month‐old tg and wt control mice. Representative images captured at 40× of the brainstem (BS) and region of interest (ROI) 2, which includes the substantia nigra. The A30P α‐syn tg mice displayed some aggregated α‐syn staining in the brain stem and in ROI 2. The A30P α‐syn tg mice displayed some increase in GFAP staining in the brain stem, compared to wt control mice, but no difference in Mac‐2 staining between tg and wt mice was observed and the inflammatory response was overall sparse
