
Figure 3.
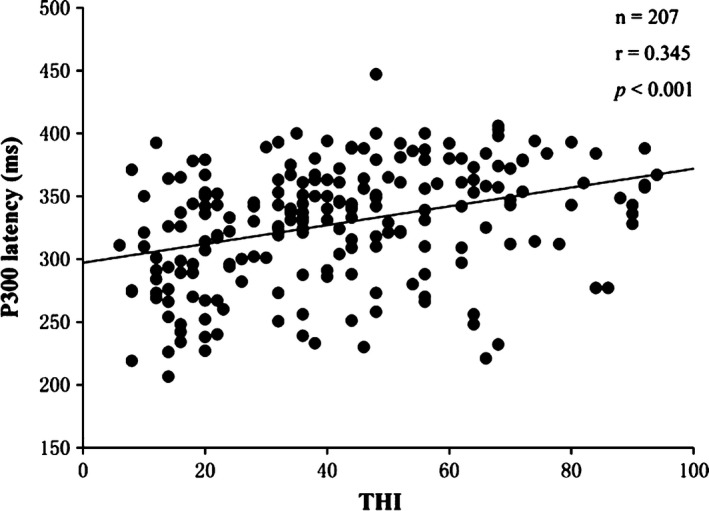
Correlation analysis scatterplot between Tinnitus Handicap Inventory (THI) scores and P3 latency showing a positive correlation between the two items (n = 207, r = .345, p < .001)
Official websites use .gov
A
.gov website belongs to an official
government organization in the United States.
Secure .gov websites use HTTPS
A lock (
) or https:// means you've safely
connected to the .gov website. Share sensitive
information only on official, secure websites.
Correlation analysis scatterplot between Tinnitus Handicap Inventory (THI) scores and P3 latency showing a positive correlation between the two items (n = 207, r = .345, p < .001)