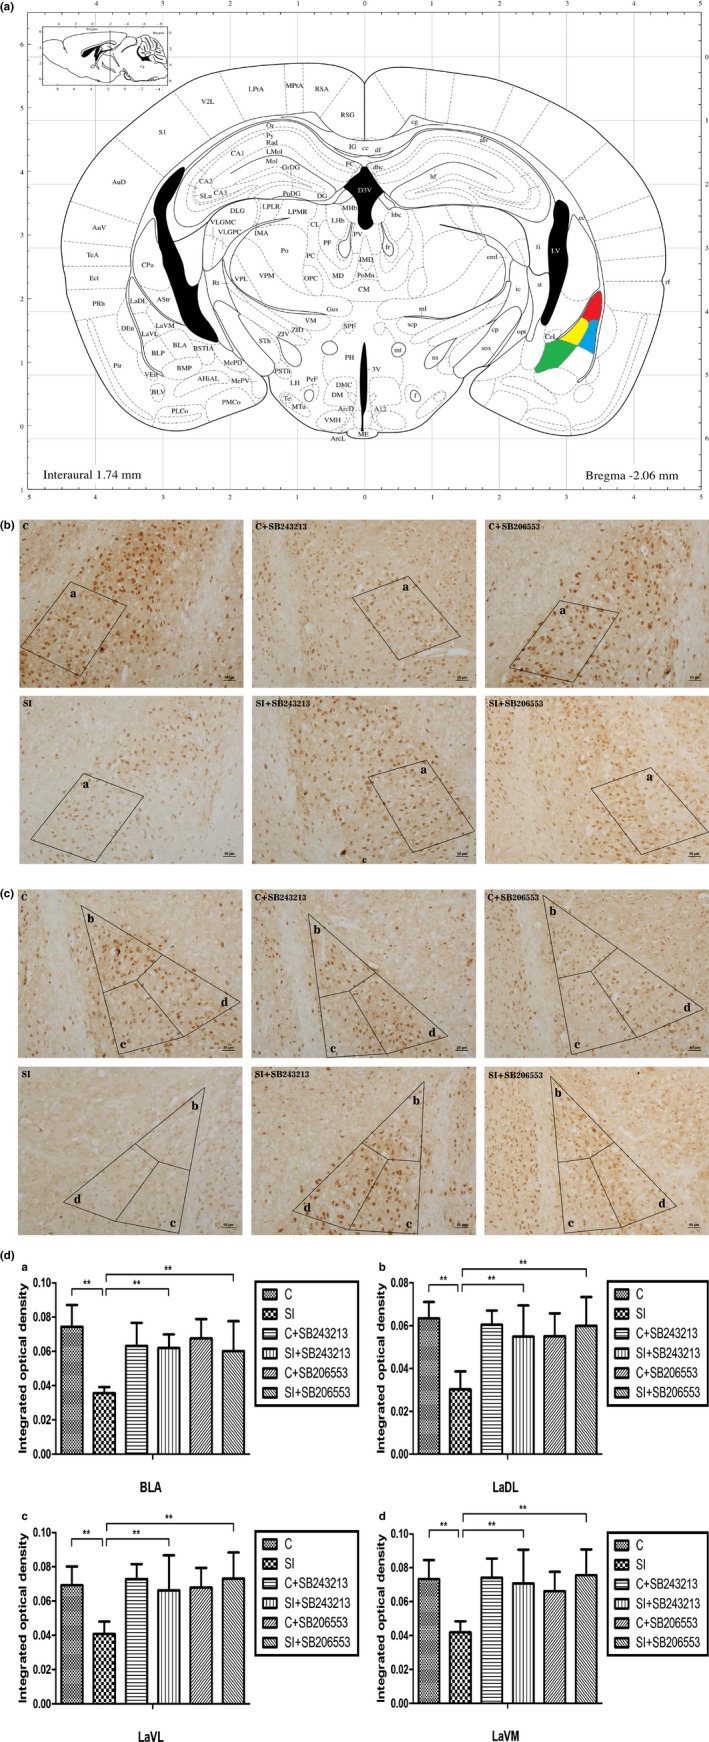
Figure 4.

Decreased ADAR1 (p110) immune‐reactivity in amygdala of social isolated BALB/c mice and its recovery by the 5‐HT 2CR antagonist SB243213/5‐HT 2CR inverse agonist SB206553. (a) The brain regions were analyzed on the basis of the mouse brain atlas of Paxinos and Franklin (1997). a/Green represents BLA:basolateral amygdaloid nucleus; b/Red represents LaDL: lateral amygdaloid nucleus dorsolateral part; c/Blue represents LaVL: lateral amygdaloid nucleus ventrolateral part; d/Yellow represents LaVM: lateral amygdaloid nucleus ventromedial part. (b) Decreased ADAR1 (p110) immune‐reactivity‐positive signals in the BLA of the isolated mice and its recovery after treatment with the 5‐HT 2CR antagonist SB243213/5‐HT 2CR inverse agonist SB206553. Scale bar = 50 μm. (c) Decreased ADAR1 (p110) immune‐reactivity‐positive signals in LaDL, LaVL, and LaVM of the isolated mice and its recovery after treatment with the 5‐HT 2CR antagonist SB243213/5‐HT 2CR inverse agonist SB206553. Scale bar = 50 μm. (d) Statistical analysis of the integrated optical density of ADAR1 (p110) immune‐reactivity‐positive signals in the amygdala of the isolated mice and its recovery after treatment with the 5‐HT 2 CR antagonist SB243213/5‐HT 2 CR inverse agonist SB206553. All data were statistically calculated as the means ± SD; **p < .01; (n = 5/group)
