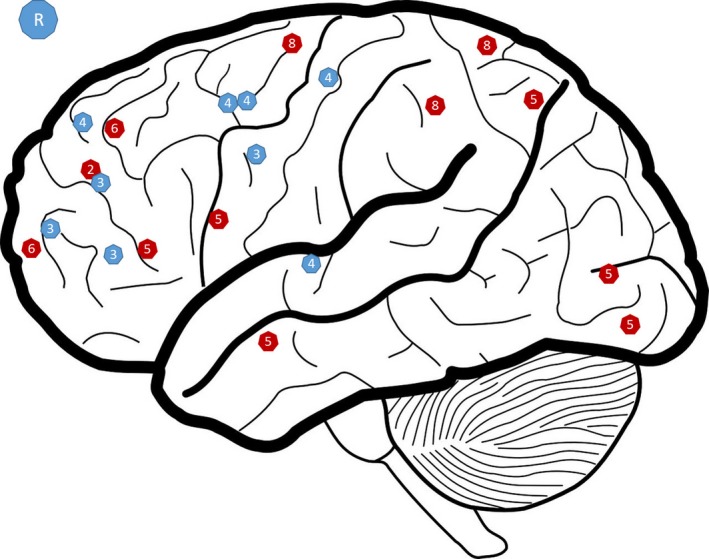
Figure 3.

Representation of zone showing significantly high levels of activation after CR in the right hemisphere (R). This figure is a qualitative representation. In red: strategy; in blue: training; 1: Bor et al., 2011; 2 : Keshavan et al. (2016); 3: Haut et al. (2010); 4: Hooker et al. (2012); 5: Penadés et al. (2013); 6: Pu et al. (2014); 7: Subramaniam et al. (2014); 8: Vianin et al. (2014)
