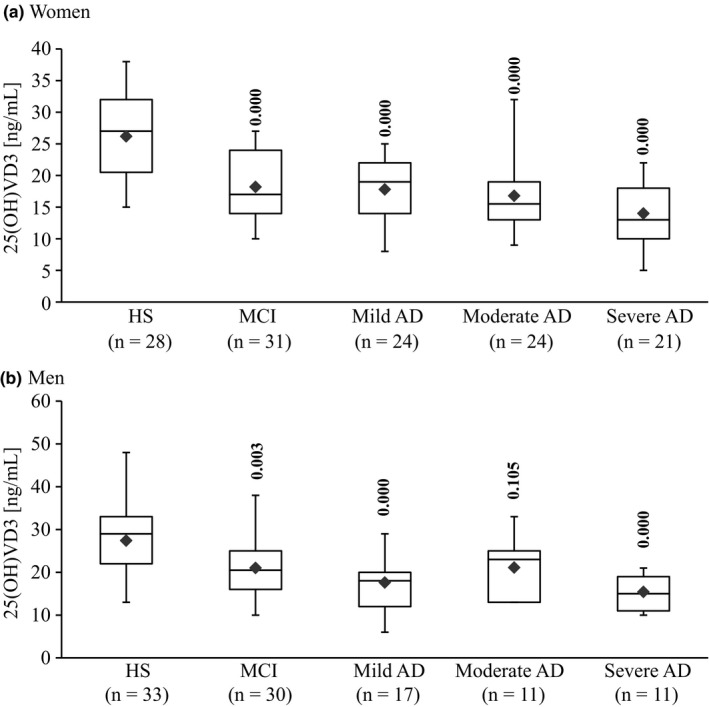
Figure 2.

Box plot of serum concentrations of 25(OH)D3 in women (a) and men (b) HS, MCI and AD. The lower and upper sides of the boxes indicate the 25th and 75th percentiles. The horizontal lines and black diamonds inside the boxes indicate the median and means, respectively. Shown are also the lower and upper whiskers that indicate the minimum and maximum values, respectively. The levels of statistically significant differences are indicated over each point. Alzheimer's disease (AD) and mild cognitive impairment (MCI) compared with healthy subjects (HS)
