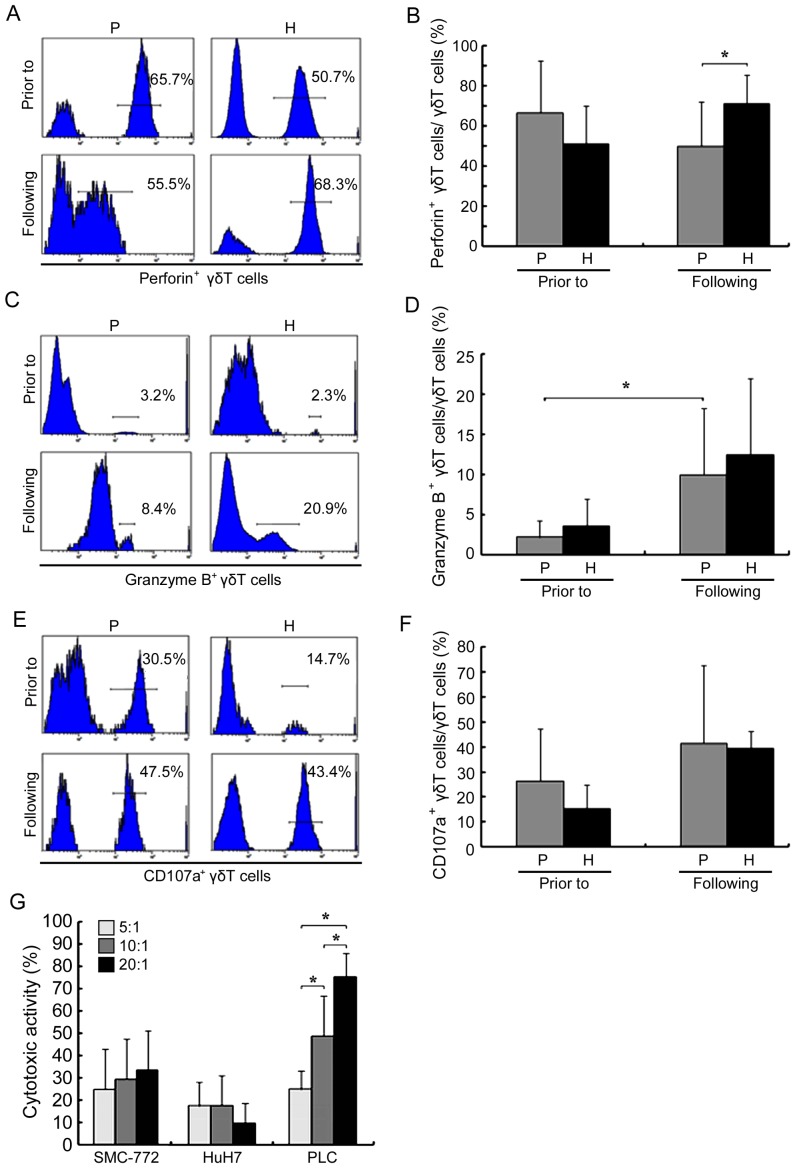
Figure 3.
Proportions of perforin+, granzyme B+ and CD107a+ γδ T cells following amplification. (A) The proportions of perforin+ γδ T cells in the peripheral blood of patients with HCC and healthy donors prior to and following amplification and (B) quantification. (C) The proportions of granzyme B+ γδ T cells prior to and following amplification and (D) quantification. (E and F) The proportions of CD107a+ γδ T cells prior to and following amplification. (G) The cytotoxic activity of γδ T cells against four HCC cell lines was assessed using an MTT assay. Results are expressed as the mean ± standard deviation. *P<0.05 with comparisons indicated by lines. HCC, hepatocellular carcinoma; P, patients; H, healthy controls; CD, cluster of differentiation.

