
FIGURE 3.
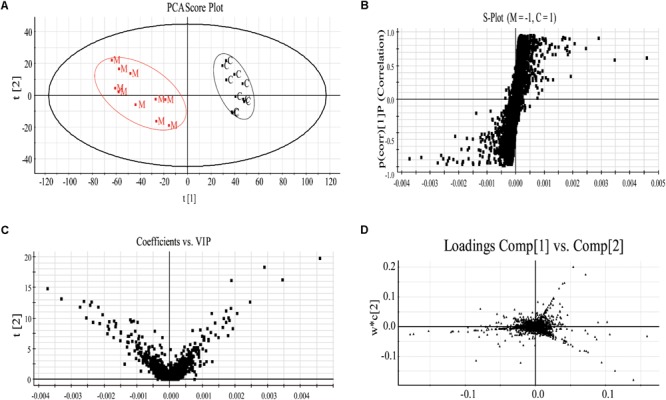
The plasma PCA score plot (A); S-plot of OPLS-DA (B); and VIP-plot of OPLS-DA (C) between control and model groups and loading plot of PLS-DA (D) of control, model and XSHG groups in negative mode (n = 10).
Official websites use .gov
A
.gov website belongs to an official
government organization in the United States.
Secure .gov websites use HTTPS
A lock (
) or https:// means you've safely
connected to the .gov website. Share sensitive
information only on official, secure websites.
The plasma PCA score plot (A); S-plot of OPLS-DA (B); and VIP-plot of OPLS-DA (C) between control and model groups and loading plot of PLS-DA (D) of control, model and XSHG groups in negative mode (n = 10).