
FIGURE 8.
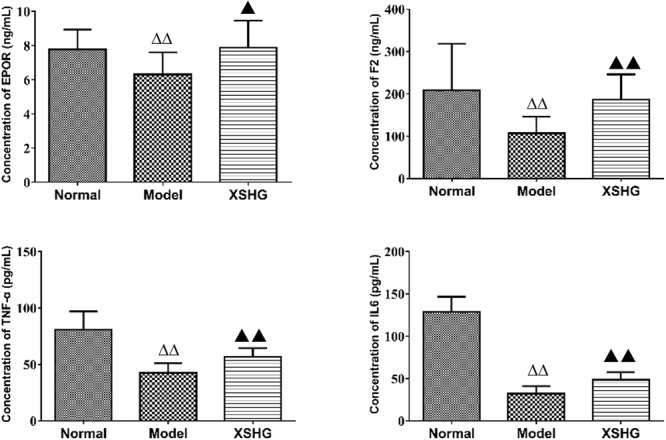
Expression of EPOR, F2, TNF-α, and IL-6 protein levels in rat plasma using ELISA analysis. Data were presented as the mean ± SD (n = 6), ΔP < 0.05, ΔΔP < 0.01 vs. normal group; ▲P < 0.05, ▲P < 0.01 vs. model group.
Official websites use .gov
A
.gov website belongs to an official
government organization in the United States.
Secure .gov websites use HTTPS
A lock (
) or https:// means you've safely
connected to the .gov website. Share sensitive
information only on official, secure websites.
Expression of EPOR, F2, TNF-α, and IL-6 protein levels in rat plasma using ELISA analysis. Data were presented as the mean ± SD (n = 6), ΔP < 0.05, ΔΔP < 0.01 vs. normal group; ▲P < 0.05, ▲P < 0.01 vs. model group.