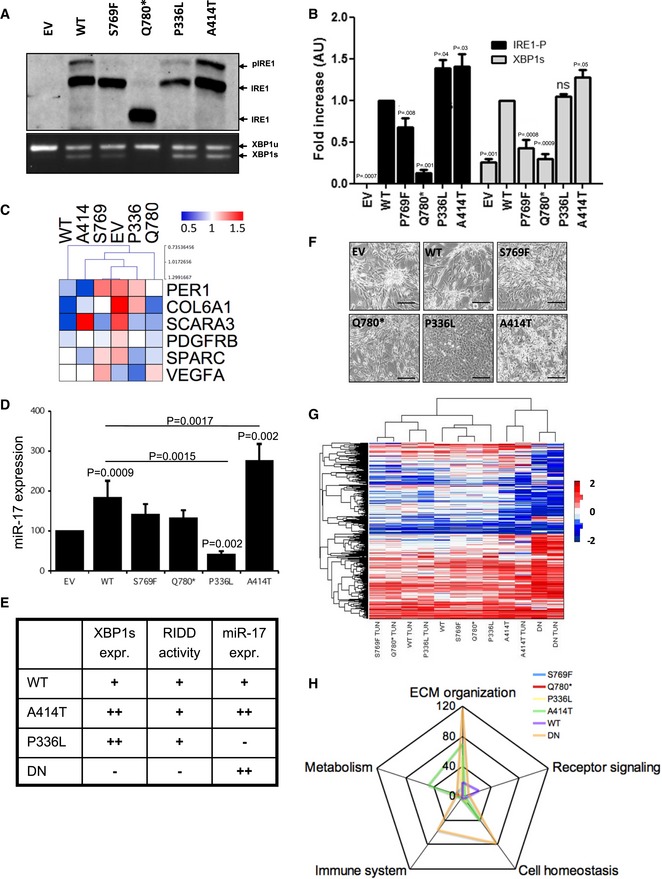
Anti‐IRE1 Phostag immunoblot showing both phosphorylated (p‐IRE1) and non‐phosphorylated (IRE1) IRE1 proteins revealed IRE1 phosphorylation in basal conditions due to overexpression of WT, P336L and A414T but not S769F nor Q780* forms of IRE1. EtBr‐stained agarose gel of XBP1 cDNA amplicons corresponding to unspliced (XBP1u) and spliced (XBP1s) forms of XBP1 mRNA revealed XBP1 splicing in basal conditions due to overexpression of WT, S769F, P336L and A414T but not Q780* forms of IRE1.
Bar graph representing the quantification of three levels of IRE1/XBP1 activation: IRE1 phosphorylation (p‐IRE1/IRE1) and XBP1 mRNA splicing (XBP1s/(XBP1u + XBP1s)) measured as indicated in (A). Three independent biological samples were used. Data from five independent experiments are presented as means ± SD. P‐values are indicated. Student's t‐test was used.
Heat‐map representation of RIDD of mRNA target expression (normalized to 18S) after 2‐h Actinomycin D (ActD) treatment. Three independent biological samples were used.
Analysis of miR‐17‐5p expression by RT‐qPCR in IRE1 variant expressing cells under basal conditions. Data from three independent experiments are presented as means ± SD. Student's t‐test was used.
Recapitulative table of the signaling properties of IRE1 WT, DN, P336L, and A414T variants.
Phenotypic characterization of U87 cells expressing the different IRE1 variants and imaged by phase contrast microscopy. Scale bar = 100 μm.
Heat‐map representation of the transcriptomes of U87‐expressing variants upon basal conditions or ER stress (induction by tunicamycin).
Schematic representation of the signaling pathway enrichment based on the transcriptome data.

