
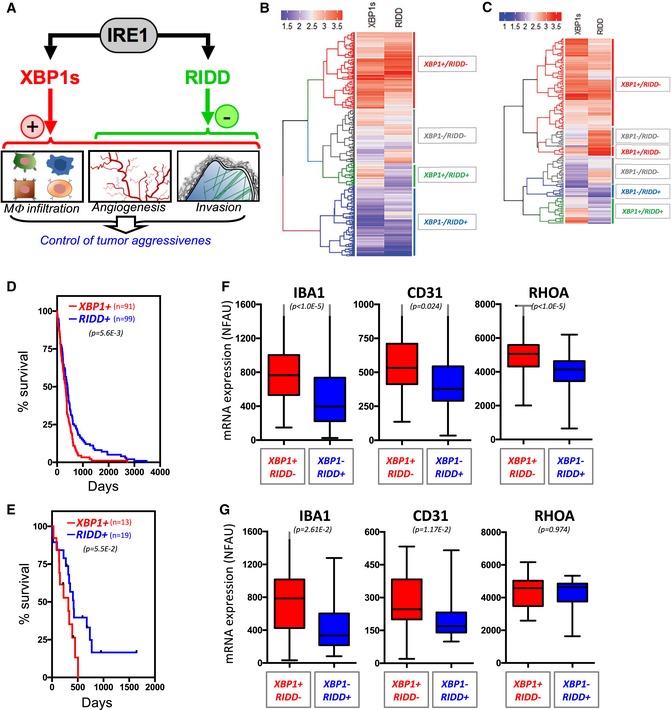
Figure 6. Deconvolution of IRE1 signaling in GBM tumors.
-
ASchematic representation of the antagonistic XBP1s and RIDD signals in GBM tumors and their biological impact on tumor aggressiveness.
-
B, CHierarchical clustering of GBM patients (TCGA cohort—microarray, B; TCGA cohort—RNAseq, C) based on XBP1s and RIDD scores (see Materials and Methods).
-
D, EKaplan–Meier survival curves of XBP1+/RIDD− (red) and XBP1−/RIDD+ (blue) GBM patients of the TCGA microarray cohort (D), TCGA RNAseq cohort (E). Student's t‐test was used.
-
F, GExpression of monocyte (IBA1), angiogenesis (CD31), and migration/invasion (RHOA) markers mRNA in the four groups established in the two cohorts. Horizontal lines indicate median; box lines indicate first & third quartiles; whiskers indicate min & max. Student's t‐test was used.