
Figure 1. Growth of TKI‐resistant EGFR delE746‐A750 PC‐9 NSCLC cells is associated with elevated cellular free fatty acid and expression of FASN, and is suppressed by EGFR knockdown.
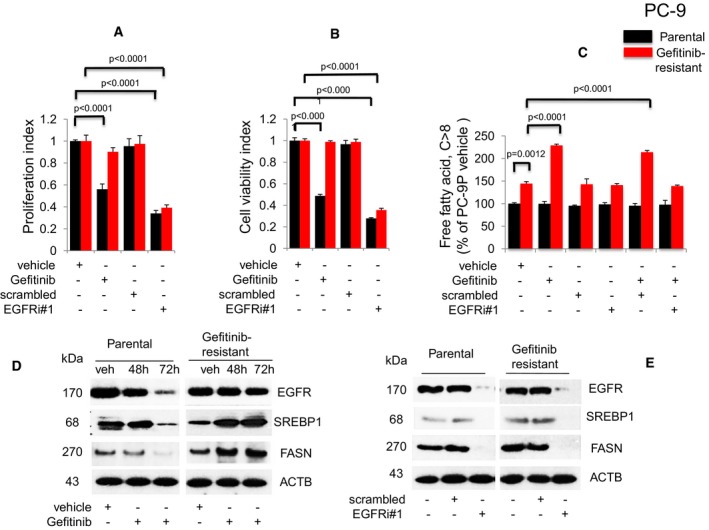
Gefitinib doses used for these experiments were 50 nM for parental and 1 μM for Gefitinib‐resistant PC‐9 cells.
-
A,BProliferation (n = 3, A) and viability (n = 3, B) assays on cells exposed to Gefitinib or EGFR siRNAs for 72 h. Significance in differences in proliferation and viability indexes, in which vehicle acted as control, was determined by t‐test. Error bars denote SEM.
-
CMeasurement of cellular free fatty acid (FFA, n = 3) after Gefitinib treatment or EGFR knockdown for 72 h. Significance in differences in cellular FFA, normalized against PC‐9P vehicle, was determined by t‐test. Error bars denote SEM.
-
DWestern blot analysis of cells treated with either vehicle (72 h) or Gefitinib (48 and 72 h).
-
EWestern blot analysis of cells exposed to either scrambled or EGFR siRNAs (EGFRi#1) for 72 h. ACTB was assessed as housekeeping gene. Vehicle cells acted as controls.