
Figure 4. Palmitoylation of EGFR alters its cellular distribution and is crucial for growth of TKI‐resistant EGFR mutated NSCLC cells.
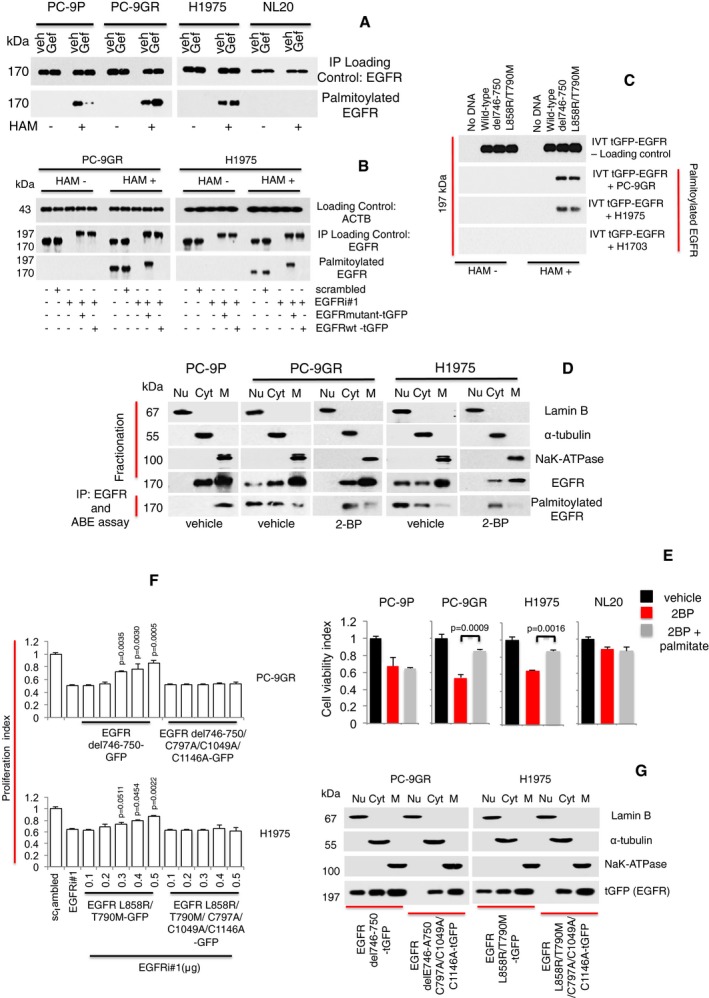
- Western blot analysis showing EGFR palmitoylation levels in PC‐9P, PC‐9GR, H1975, and NL20 cells treated with Gefitinib for 72 h. Hydroxylamine (HAM) is a strong reducing agent that cleaves palmitate from cysteine residues and is necessary for biotinylation. The omission of HAM cleavage (HAM‐) serves as negative control for ABE assay.
- Western blot data showing EGFR palmitoylation in cells treated with either scrambled, EGFRi#1, EGFRi#1 plus tGFP‐tagged EGFR mutant combination, or EGFRi#1 plus tGFP‐tagged EGFR wild‐type for 72 h. tGFP‐tagged EGFR is about 197 kDa, while EGFR is 170 kDa.
- Western blot analysis showing palmitoylation of mutated EGFR under cell‐free conditions. Cell‐free synthesized tGFP‐tagged EGFR was generated by in vitro translation using vectors containing EGFR wild‐type or mutants (del746‐750 or L858R/T790M), with no DNA/template as negative control. Fresh extracts of PC‐9GR, H1975 and H1703 cells were prepared in hypotonic buffer. For in vitro palmitoylation, synthesized tGFP‐tagged EGFR was incubated in cell extracts for 1 h at 37°C, followed by ABE assay and Western blotting.
- Vehicle‐ and 2‐bromopalmitic acid (50 μM of 2‐BP)‐treated cells were harvested and cellular fractionation was carried out to obtain nuclear, cytosolic, and membrane fractions and a part of these fractions were analyzed by Western blotting to detect EGFR. The remaining fractions were subjected to EGFR pulldown by anti‐EGFR antibody and in vitro ABE assay. Palmitoylation of EGFR was then determined by Western blot analysis.
- Cell viability assays (n = 3) of cells were first treated with 250 μM of 2‐BP for 24 h, followed by the supplementation of 10 μM of palmitate and a further incubation for 48 h. Significance in differences in viability index, in which 2‐BP‐treated cells acted as controls, was determined by t‐test. Error bars denote SEM.
- Growth curves (n = 3) illustrating the proliferation index of cells treated with scrambled, EGFR siRNAs (EGFRi#1) alone or in combination with transfection of tGFP‐tagged EGFR mutant (del746‐750 or L858R/T790M) constructs with or without C797A/C1049A/C1146A mutations for 72 h. Significance in differences in proliferation index, in which EGFRi#1 cells acted as controls, was determined by t‐test. Error bars denote SEM.
- Cells were transfected with tGFP‐tagged EGFR mutant (del746‐750 or L858R/T790M) constructs with or without C797A/C1049A/C1146A mutations and harvested after 72 h. Cellular fractionation was performed to separate nuclear, cytosolic, and membrane fractions. Fractionates were then analyzed by Western blot analysis to detect the distribution of tGFP‐tagged EGFR with anti‐tGFP antibody.
Source data are available online for this figure.