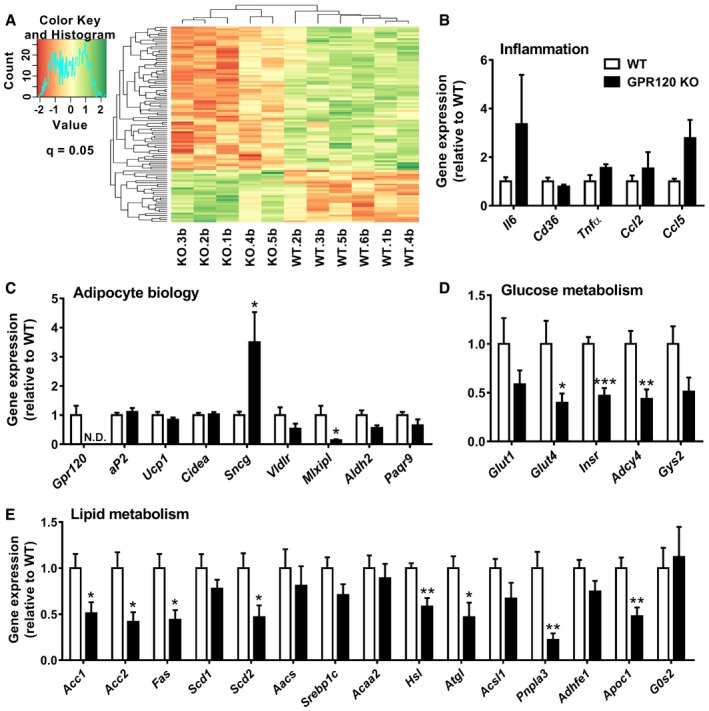
Figure 5. GPR120 deficiency alters the expression of genes involved in glucose and lipid metabolism in BAT .

-
AProbe sets for WT and GPR120 KO BAT from microarray analysis are colored according to average expression levels across all samples, with green denoting a higher expression level and red denoting a lower expression level. The probe sets shown in the heat map passed the threshold of absolute value of the logFC > 0.5 and P‐adjusted < 0.05.
-
B–EExpression of genes involved in inflammation, adipocyte biology, glucose metabolism, and lipid metabolism in BAT from GPR120 KO mice (n = 5) and WT littermates (n = 6) was determined through qRT–PCR (N.D. = non‐detectable). Data represent means ± SEM. *P < 0.05, **P < 0.01, ***P < 0.001 compared to the WT control group, according to the two‐tailed unpaired Student's t‐test. The exact P‐value for each significant difference can be found in Appendix Table S5.
