Figure 4.
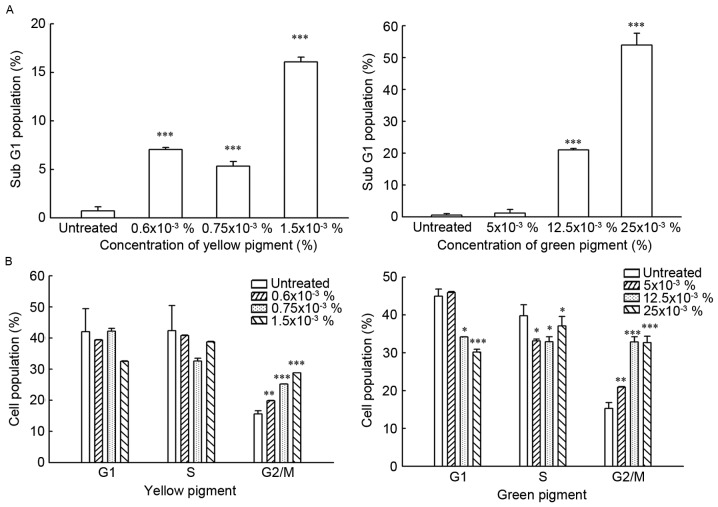
(A) Apoptotic analysis of green or yellow pigment-treated DLD-1 cells. ***P<0.001 vs. untreated. (B) Cell cycle analysis of green or yellow pigment-treated DLD-1 cells. DLD-1 cells were plated in 60 mm culture dishes at 80% confluence and treated with the indicated concentrations of pigment for 24 h. Following treatment, the cells were harvested and fixed in phosphate-buffered saline-methanol (v/v, 1:2) solution. The cells were stained with propidium iodide followed by flow cytometric analysis. *P<0.05, **P<0.01 and ***P<0.001 vs. untreated.

