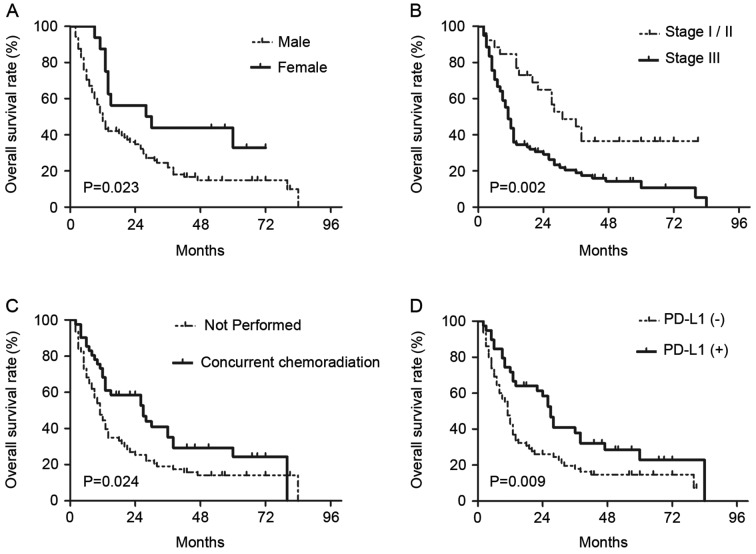
Figure 3.
Kaplan-Meier curves showing differences in overall survival rates according to (A) sex, (B) clinical stage, (C) receipt of concurrent chemoradiation, and (D) PD-L1 expression in patients with esophageal carcinoma. P-values were determined by log-rank test. PD-L1, programmed death ligand 1.

