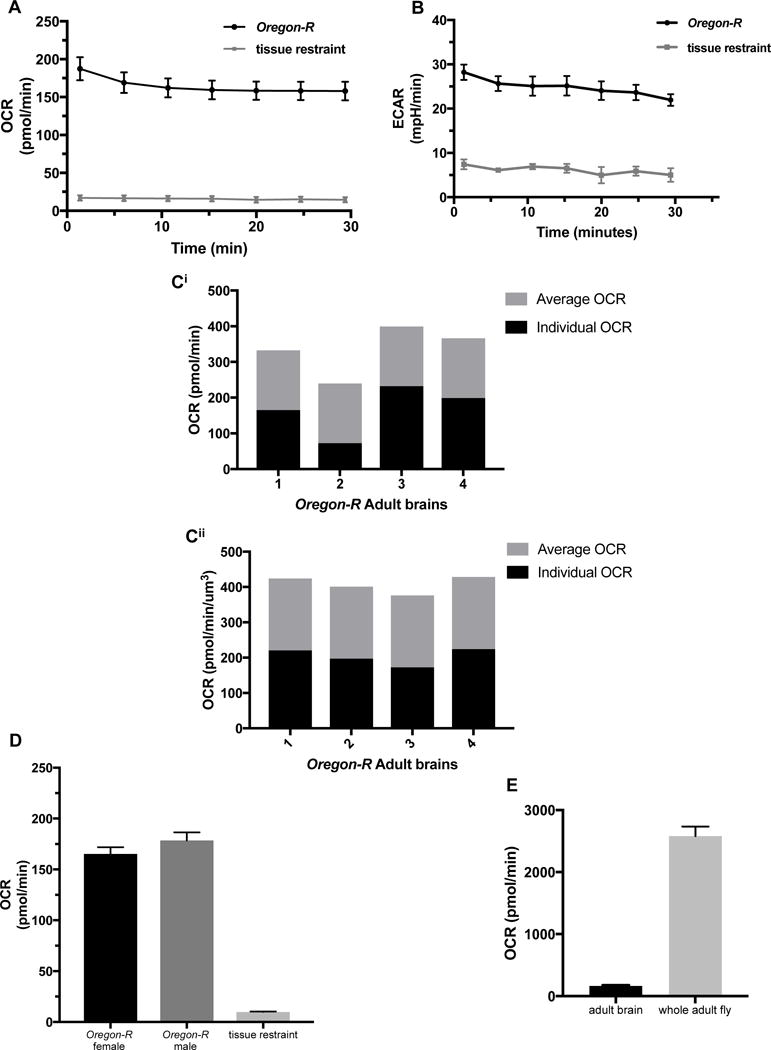
Fig. 4.

Metabolic analysis of single Drosophila adult brains.
A) Basal OCR levels of Oregon-R adult brains for 7 cycles using one-minute mix and three-minute measure procedure, n=8. B) Basal ECAR levels of Oregon-R adult brains for 7 cycles using one-minute mix and three-minute measure procedure, n=7. Ci) OCR levels of single Oregon-R adult brains. Black bars represents individual OCR, and gray bars indicated average of all brains depicted in figure. Cii) Oregon-R adult brains from Ci normalized using volume; reported in pmol/min/μm3. Black bars represents individual OCR, and gray bars indicated average of all brains depicted in figure. D) Basal OCR levels of Oregon-R male and female adult brains measured at the 6th cycle, n=5. E) Basal OCR levels of Oregon-R adult brains at the 6th cycle using the XFe96 metabolic analyzer (n=5) compared to respiration of the whole Oregon-R adult fly measured using stop flow respirometry (n=9).
