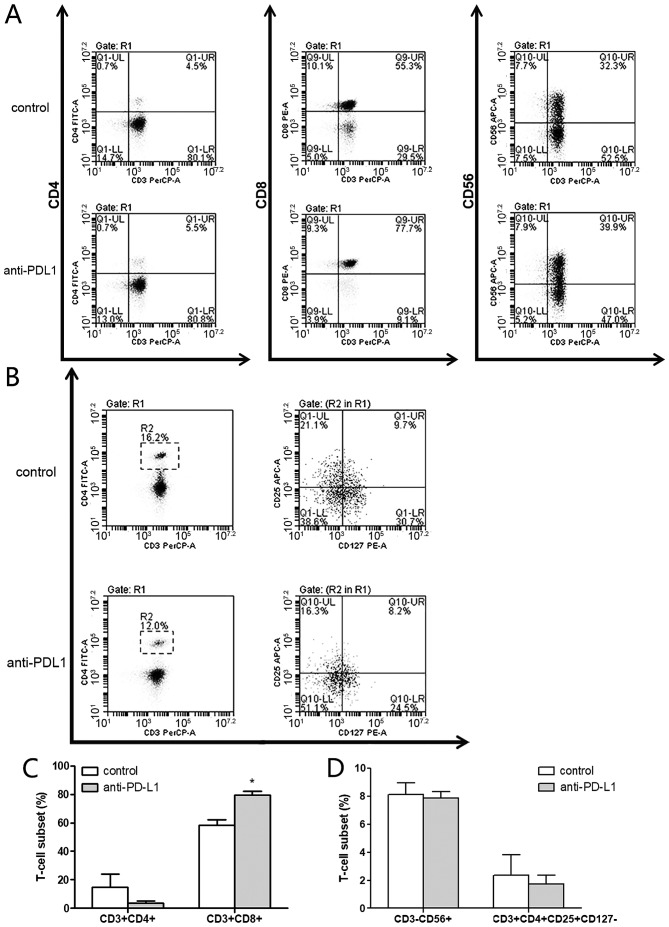
Figure 4.
Anti-PD-L1 induces a higher percentage of CTLs in vitro. Expression of surface markers was measured on day 15 by flow cytometry analysis. (A and B) Antibodies directed against CD3, CD4, CD8, CD56, CD25 and CD127 were used to measure the expression of cell surface markers by flow cytometry. (C) The percentage of helper T cells (CD3+CD4+) and cytotoxic T lymphocytes (CD3+CD8+). (D) The percentage of NK cells (CD3−CD56+) and regulatory T cells (CD3+CD4+CD25+CD127−). *P<0.05 vs. control. CD, cluster of differentiation; NK, natural killer; PD-L1, programmed death-ligand 1.

