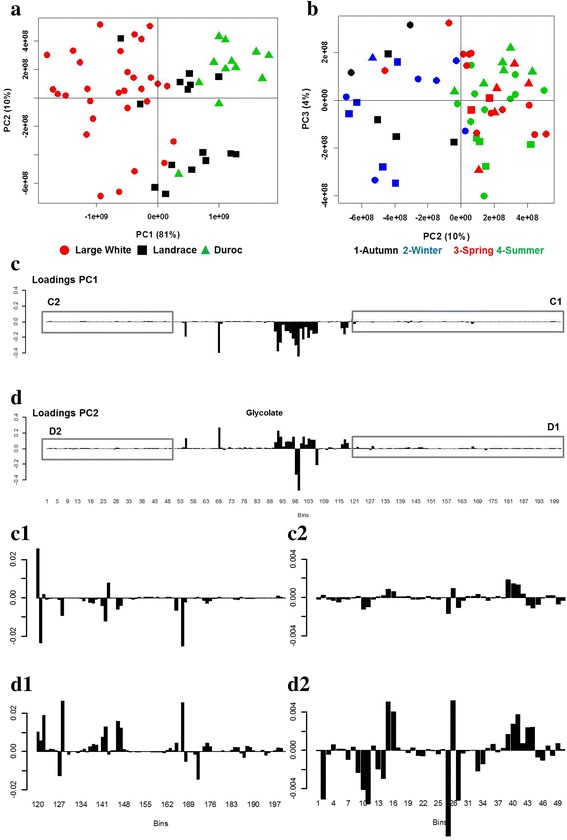
Fig. 2.

Score plots of PCA on 1H–NMR binned spectra of colostrum. a PC1 vs. PC2 and b PC2 vs. PC3. The first two PCs represent the 91% of the total variance. c-d Loadings bar-plot for spectral bins along PC1 and PC2 respectively. Downfield (C1 and D1) and upfield (C2 and D2) regions of C and D loadings bar-plot were expanded on the vertical scale to appreciate the presence of small bar plot
