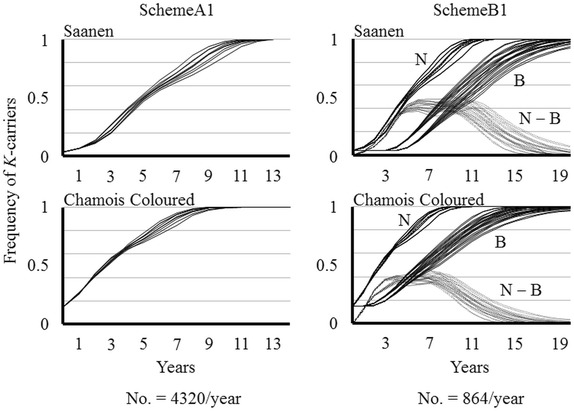
Figure 1.

Effects of selection on the K-carrier frequency without time limits. All patterns of age structure are provided. SchemeA1: selection on the overall population. Scheme B1: selection on the nucleus herds (N) and dissemination to the base (B). N − B is the difference in frequency of the K-carriers between nucleus and base. No. is the number of candidate males to be genotyped every year.
