
Figure 2.
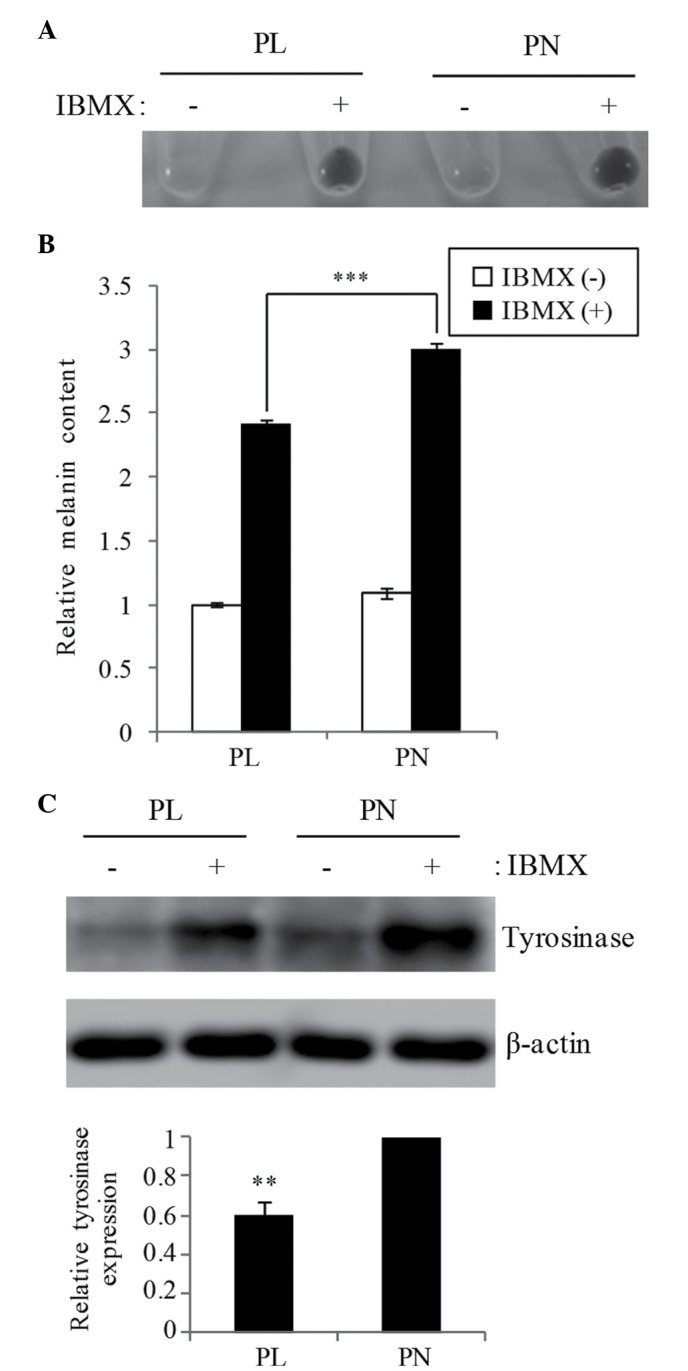
Effect of PL and PN on melanogenesis in B16F10 cells. Cells were cultured with 20 µM PL or PN for 24 h and then treated with 100 µM IBMX for 48 h. PL and PN were contained in the medium in total for 72 h. Melanin content of cultured cells were evaluated for (A) visualization and (B) absorbance at 450 nm. The data represent mean ± SD (n=4). Statistically significant difference is indicated as ***P<0.001. (C) Tyrosinase expression was examined by western blot analysis (upper panel) and showed a graphical representation of the relative signal intensity of tyrosinase (lower panel). The data represent mean ± SD (n=3). **P<0.01 indicates significant difference compared to PN. PL, pyridoxal; PN, pyridoxine; IBMX, 3-isobutyl-1-methylxanthine.