Fig. 1.

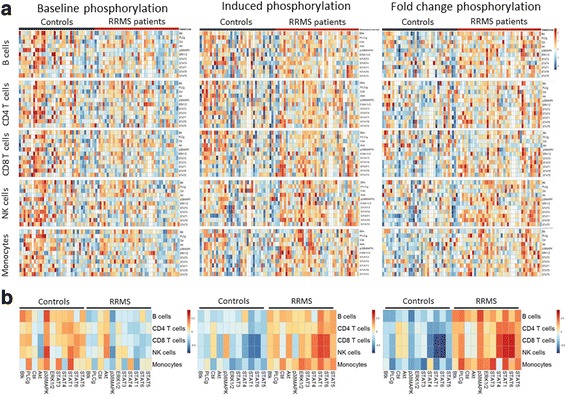
Immune cells from MS patients show a distinct phosphorylation signature in baseline conditions and upon in vitro stimulation. PBMCs from RRMS patients (n = 41) and healthy controls (n = 37) were either left unstimulated or activated for 15 min with H2O2 for Btk, PLCγ, Akt, and c-Cbl activation, PMA for p38MAPK and Erk1/2 activation, and human IFN-α for STAT proteins activation. a The individual z-score transformation of the MFI of each phosphorylated protein or the fold change of phosphorylation has been represented for each cell population in each subject of the study. b The summary of the z-scores of the MFI of each phosphorylated protein or the fold change of phosphorylation has been represented for each cell population in MS patients and controls. MS patients show lower levels of phosphorylated proteins in baseline conditions, and increased levels of phosphorylated proteins and increased fold changes of phosphorylation after stimulation compared to healthy controls. Levels of phosphorylated proteins higher than the mean are shown in red and levels of phosphorylated proteins lower than the mean are shown in blue
