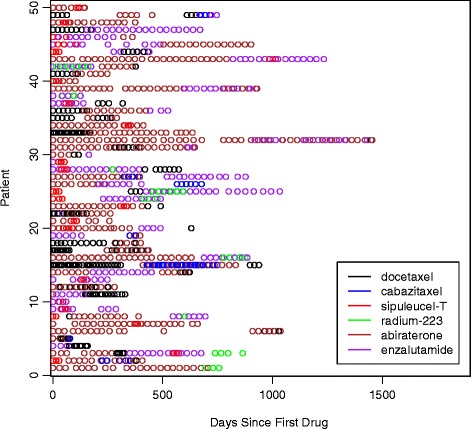
Fig. 2.

Treatment Patterns. Treatment patterns for 50 randomly selected patients who were identified to have received at least two distinct therapies concurrently during follow-up. Each horizontal row of circles represents one patient and each colored circle represents a claim for a drug for that patient. For example, the first patient listed at the top of the figure appears to have received 7 claims for abiraterone over a period of several months, but also received three claims for sipuleucel-T at some point during the time they were also undergoing treatment with abiraterone
