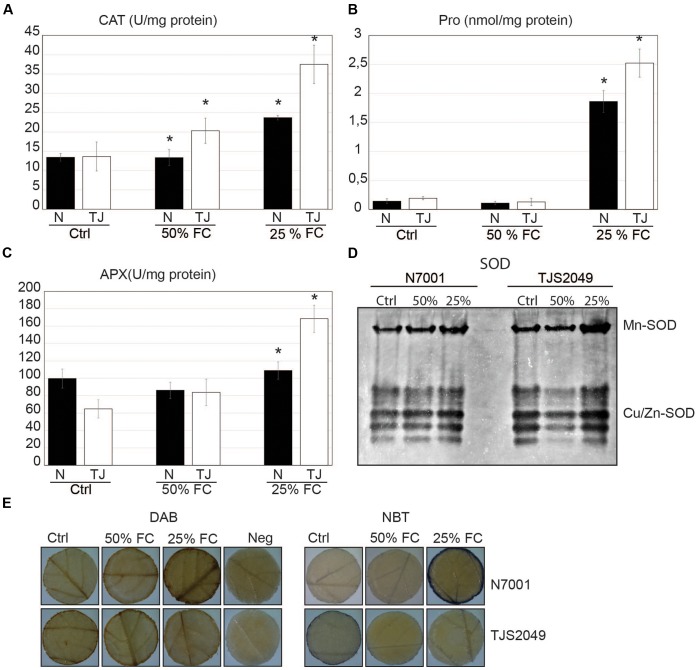
FIGURE 1.
Biochemical responses associated with drought stress status in soybean genotypes. Soybean genotypes: N7001 (N) and TJS2049 (TJ). (Ctrl): Control plants, daily irrigated at maximum field capacity (FC); (50% FC): moderate early dehydration stress; or (25% FC): severe late dehydration stress. (A) CAT activity; (B) proline levels; (C) APX activity in soybean genotypes, grown until V3 and subsequently subjected to moderate stress (3 days without irrigation, 50% FC); or severe dehydration stress (7 days without irrigation: 25% FC). CAT and APX activities are expressed in units per milligram of protein (U/mg). Proline concentration is expressed in nmol per milligram of protein (nmol/mg protein). The values shown are means from one representative technical replicate. Error bars indicate SD (n = 10). Three biological replicates were carried out. Significant differences of at least 0.05 confidence level between N7001 and TJS2049 soybean genotypes are marked by asterisks. (D) Appearance of SOD activity bands corresponding to different isoforms. Twenty μg of proteins were analyzed in native polyacrylamide gels using in-gel activity assays. (E) In situ determination of H2O2 and O2 by staining leaf disks with DAB or NBT, respectively. Neg, negative control for DAB staining. Images are the most representative of a pool of five leaf disks per plant/per treatment.

