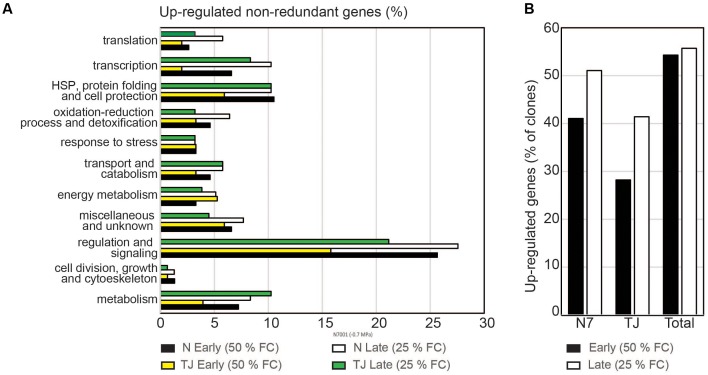
FIGURE 3.
Genotype specific transcriptional responses. (A) Percentage of screened genes within each functional category, that were stress-induced in each genotype. Upregulation was determined based on the difference in hybridization signal intensities observed between forward and subtracted probes. Probes derived from N7001 (N) or TJS2049 (TJ) genotypes, at early stress (50% FC) or at late stress (25% FC). Forward subtracted: stress – control. Reverse subtracted: control – stress. (B) Percentage of upregulated genes in each soybean genotype, during the early stress response or the late stress response.

