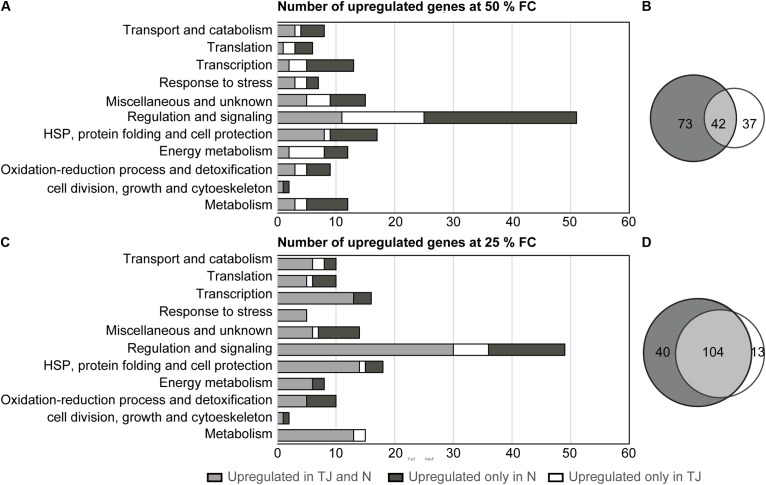
FIGURE 4.
Analysis of overlapping and non-overlapping drought-induced genes in N7001 or TJ2049. Numbers and distribution into functional categories, of clones corresponding to upregulated genes in response to dehydration. (A) Moderate early stress (50% FC); (B) severe late stress 25% FC). Upregulated genes were selected based on their hybridization signal intensity with specific subtracted cDNA probes. Venn diagram analysis of differentially expressed gene sets indicating the total number of clones corresponding to overlapping and non-overlapping upregulated genes, during early (C) or late (D) drought stress. N (N7001), TJ (TJS2019).

