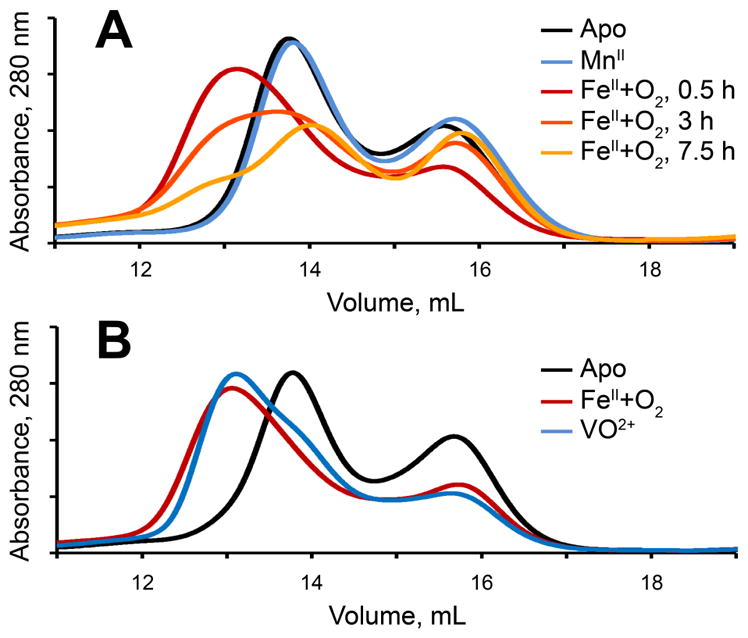
Figure 4.

Size-exclusion chromatography of L-cyclopropylglycinyl-S-SyrB1 and SyrB2. (A) SyrB1 and Fe(II)-SyrB2 exposed to oxygen for 0 h (red), 3 h (orange), and 7.5 h (gold) prior to loading. Apo-SyrB2 (black) and Mn(II)-SyrB2 (blue) are depicted for comparison. (B) SyrB1 and SyrB2-VO (blue), Fe(II)-SyrB2 (red), and apo-SyrB2 (black). SyrB2, FeII or VO2+, Cl−, 2OG, and L-cyclopropylglycinyl-S-SyrB1, mixed to final concentrations of 150 μM, 140 μM, 2.7 mM, 0.8 mM, and 150 μM, respectively, were applied to a GE Healthcare Superdex 200 10/300 GL column and eluted at 0.7 mL/min with 50 mM sodium HEPES pH 7.6, 150 mM NaCl.
