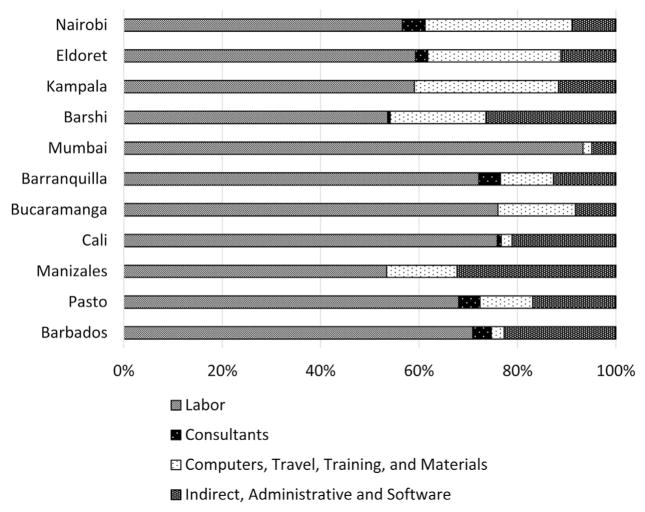
Fig. 1.
Registries’ Resources by Budget Categories.
Note: For the Nairobi Cancer Registry, Kenya, we show the average cost results using data collected for July 2012–June 2014. For all other registries, we show results from the first round of data collection for the following periods: Kampala Cancer Registry, Uganda – 2014 annual cost data; Mumbai Cancer Registry, India – fiscal year 2014–2015 cost data; Barranquilla, Bucaramanga, Cali, Manizales, and Pasto Cancer Registries, Colombia – 2013 annual cost data; and Barbados Cancer Registry – April 2014–March 2015.

