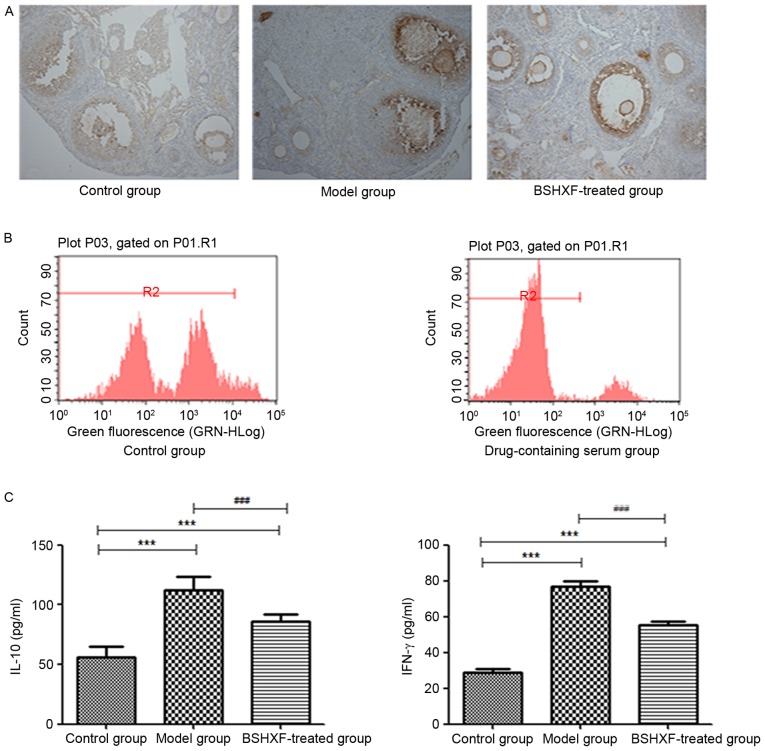
Figure 6.
(A) Immunohistochemical staining of CD4+ in the ovaries (magnification, ×200). (B) CFSE-based proliferative assay for CD4+ CD25+ Treg lymphocytes. (C) ELISA analysis of IL-10 and IFN-γ expression in the spleen of the three groups. In the control, model and BSHXF-treated groups, the levels of IL-10 were 55.647±9.185, 111.918±11.282 and 85.742±6.166, respectively, and the levels of IFN-γ were 28.831±11.024, 76.844±13.736 and 55.183±11.595, respectively. ***P<0.001 vs. the control group; ###P<0.001 vs. the model group. BSHXF, Bu Shen Huo Xue formula; IL, interleukin; IFN-γ, interferon-γ.

