Fig. 3.

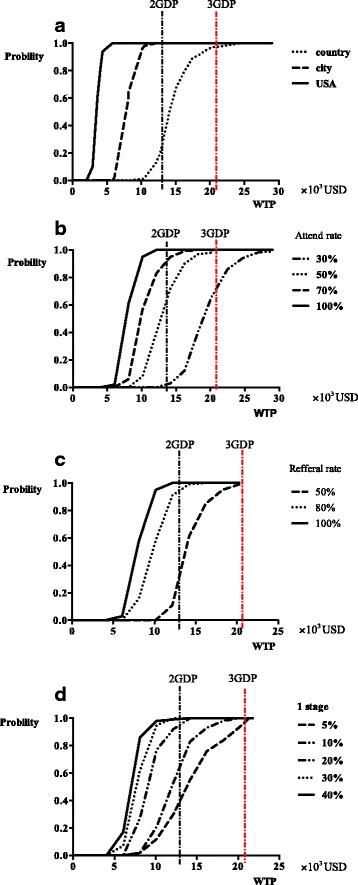
a The acceptable curves for different breast cancer incidence. b The acceptable curves for different attend-rate. c The acceptable curves for referral rate. d The acceptable curves regarding to different proportions of stage 1 tumor assumed

a The acceptable curves for different breast cancer incidence. b The acceptable curves for different attend-rate. c The acceptable curves for referral rate. d The acceptable curves regarding to different proportions of stage 1 tumor assumed