
Figure 1.
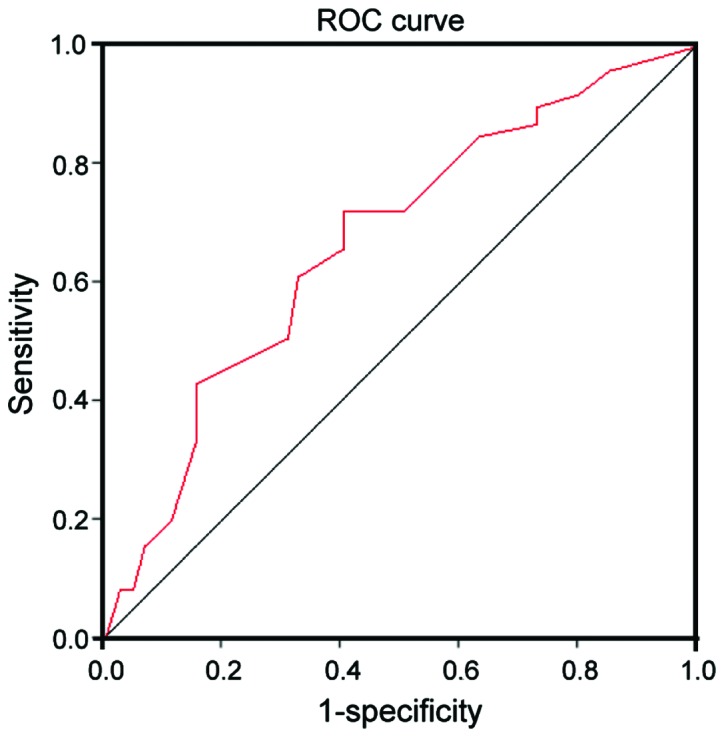
ROC curves of AMPD1 in serum of PTC and normal control group. The value of AMPD1 is high in predicting risk of PTC, AUC is 2.93 and 95% CI is 1.52–7.04.
Official websites use .gov
A
.gov website belongs to an official
government organization in the United States.
Secure .gov websites use HTTPS
A lock (
) or https:// means you've safely
connected to the .gov website. Share sensitive
information only on official, secure websites.
ROC curves of AMPD1 in serum of PTC and normal control group. The value of AMPD1 is high in predicting risk of PTC, AUC is 2.93 and 95% CI is 1.52–7.04.