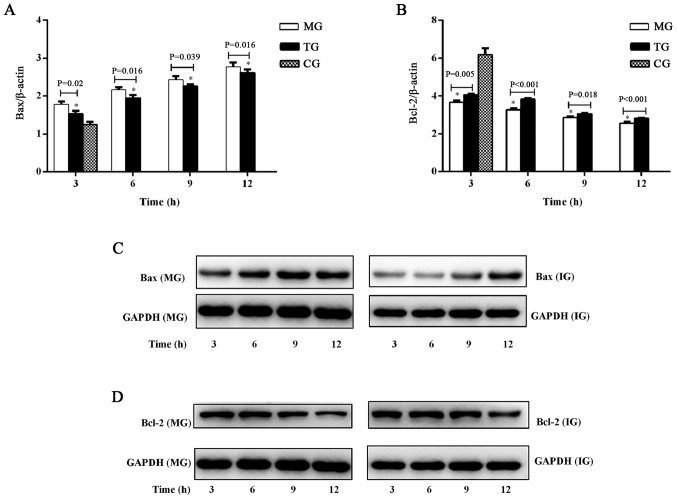
Figure 5.
Effect of thymosin α1 treatment on the expression of Bax and Bcl-2 in liver tissue. (A) mRNA levels of Bax. (B) mRNA levels of Bcl-2. (C) Bax protein expression. (D) Bcl-2 protein expression. Data are expressed as the mean ± standard error of the mean (n=3). *P<0.05 vs. the CG group. CG, control group; MG, model group; TG, treatment group; AI, apoptotic index; Bcl-2, B-cell lymphoma 2; Bax, Bcl-2-associated X protein.

