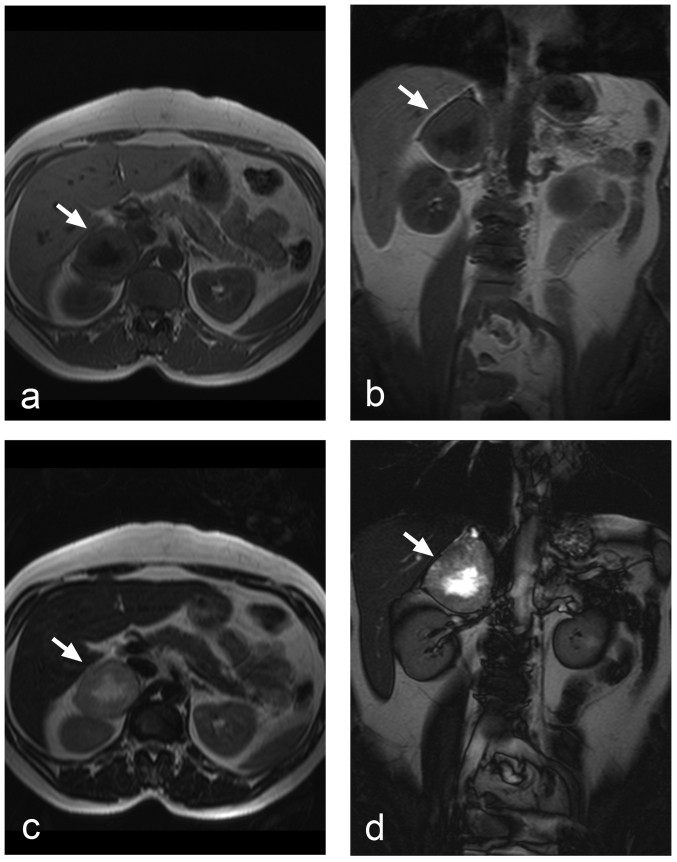
Figure 3.
Adrenal pheochromocytoma on the right side (arrows): (a) T1-weighted spoiled gradient echo in the axial plane, (b) T1-weighted spoiled gradient echo in the coronal plane, (c) T2-weighted turbo spin echo in the axial plane, (d) True FISP in the coronal plane. T2-weighted image showing typical high signal intensity in the central necrotic part, which appears hypointense in T1-weighted images.

