Figure 6.
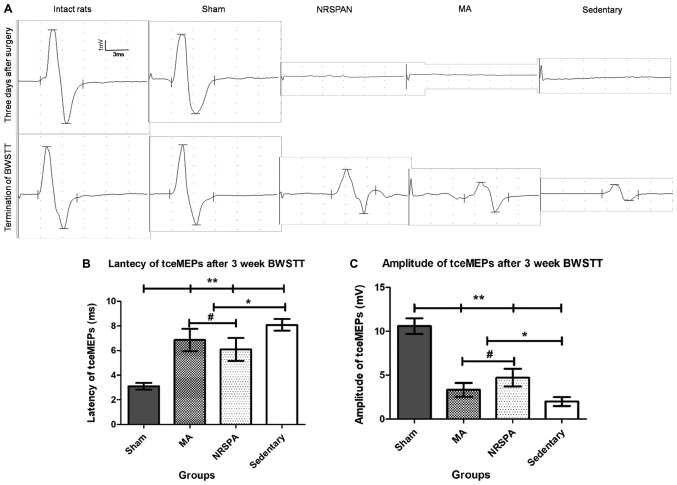
The representative tceMEPs waveforms at the beginning and the termination of BWSTT and the tceMEPs parameters analysis. (A) The variation trends of tceMEPs waveforms in all experimental groups by comparing the tceMEPs waveforms obtained at 3 days after surgery and the termination of the 3 weeks of BWSTT. The sham group had exactly the same waveform as the intact rats. The tceMEPs waveforms could not be detected in the three SCI groups (NRSPA, MA and sedentary) 3 days after surgery. Following a 3-week BWSTT, the latencies and amplitudes of tceMEPs waveform in NRSPA group gained the greatest increase in contrast to those of the MA and sedentary groups. (B and C) The results of statistical analysis for latency and amplitude of tceMEPs, respectively. One-way ANOVA and LSD were used for statistical analysis and P<0.05 was statistically significant. #P<0.05, *P<0.01, **P<0.001. (B) represents significant differences in the latency of tceMEPs between the NRSPA group and MA group (P<0.05). (C) The significant differences in the amplitude of tceMEPs between the two BWSTT groups (NRSPA and MA group) (P<0.05). tceMEPs, transcranial electrical motor-evoked potentials; BWSTT, body-weight-supported treadmill training; SCI, spinal cord injury; NRSPA, normal rat stepping pattern assistance; MA, manual assistance.

