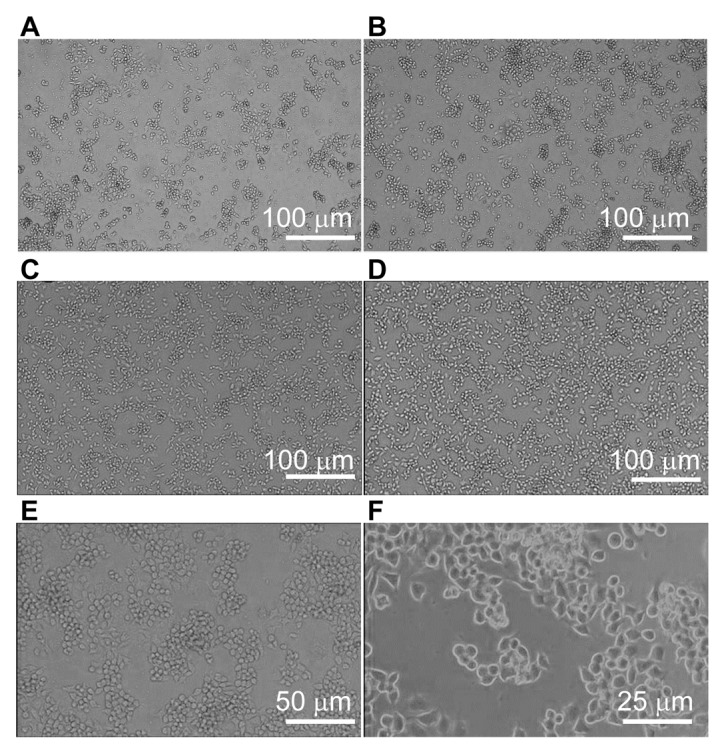
Figure 2.

Images of RAW264.7 unstained cells under an inverted microscope in the (A) control group, and the (B) low (150 mg/l), (C) medium (300 mg/l) and (D) high (600 mg/l) concentration SAP groups (magnification, ×50). (E and F) Higher magnification images for the high concentration SAP group [(E) magnification, ×100; (F) magnification, ×200 (phase difference method)]. SAP, Saccharum Alhagi polysaccharides.
