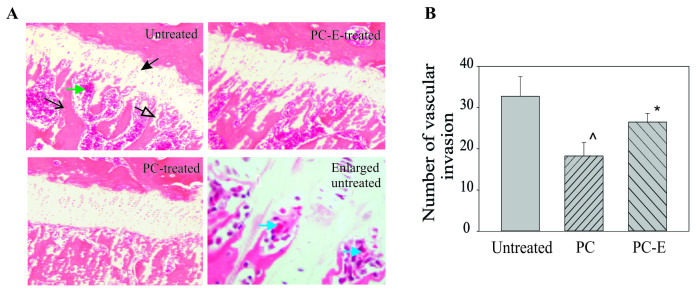
Figure 4.
Effect of PC and PC-E on the growth plate and marrow space at the junction between the growth plate and metaphysis. (A) Representative hematoxylin and eosin stained-sections (magnification, ×4). The solid black arrow indicates the growth plate. The open black arrow indicates growth plate cartilage bars or islands. The line black arrow indicates the metaphyseal bone. The green arrow indicates the marrow space. Blue arrows indicate red blood cells within the marrow space in the enlarged image of the junction (magnification, ×20). (B) Number of marrow spaces in the untreated, PC- and PC-E-treated guinea pigs. *P<0.05 vs. untreated; ^P<0.05 vs. untreated and PC-E. PC, phosphocitrate; PC-E, PC-β ethyl ester.

