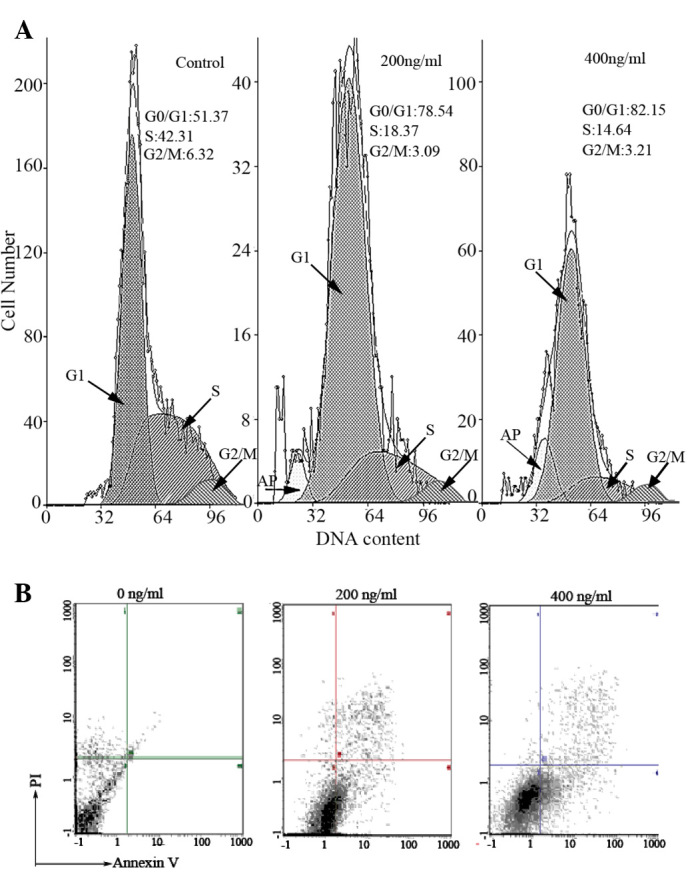
Figure 2.

(A) Effect of TcdA on apoptosis and cell cycle distribution in K562/A02 cells in the Control, TcdA (200 ng/ml) and TcdA (400 ng/ml) treatment groups. Arrows indicate apoptosis peaks. Mean cells in the G0/G1 phase increased and then decreased in the S phase following treatment with TcdA, and marked apoptosis peaks were observed. (B) TcdA induced apoptosis in K562/A02 cells. The results revealed a significant accumulation of Annexin V-fluorescein isothiocyanate positive cells and the percentage of apoptotic cells was 14.05 and 22.89%, following treatment with 200 and 400 ng/ml of TcdA, respectively. TcdA, Clostridium difficile toxin A; PI, propidium iodide.
