Figure 2.
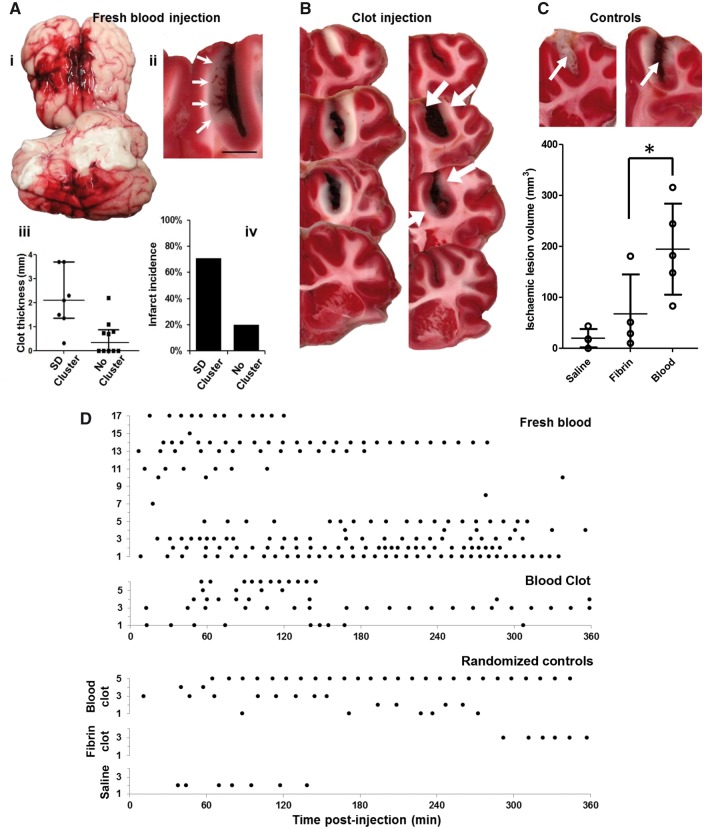
Spreading depolarizations and pathology following subarachnoid haemorrhage in the swine. (A) Cohort 1 experiments using fresh blood. (i) Gross pathology after 6 h showing the persistence and spread of subarachnoid blood through the injected (right) hemisphere, including presence along the Sylvian fissure and ventrolateral surface, as well as surface midline structures of both hemispheres. (ii) TTC-stained coronal section shows subarachnoid clot formation in the cruciate sulcus with infarction (arrows) of the medially adjacent cortex. Infarcted cortex lacks red TTC stain. Scale bar = 5 mm. (iii) Scatter plots of sulcal clot thickness and (iv) infarct incidence for animals with spreading depolarization (SD) clusters (n = 7) and animals with sparse or no spreading depolarizations (n = 10). Bars in iii show median and quartiles. (B) Cohort 2 experiments using clotted blood. Sequential 5-mm TTC-stained coronal sections show sulcal subarachnoid clots and adjacent cortical infarction in two representative animals. In the right image, the cortex is infarcted around the full extent of the clot, including the sulcal depth, and even extends anteriorly (top section) beyond the clot. In the left image infarcts (white arrows) are scattered, less extensive, and discontinuous, though present only adjacent to the clot. (C) Ischaemic lesion volumes following randomization to sulcal injection of saline, fibrin sealant, or clotted blood. Bars show means and standard deviations (*P < 0.05; see text). Upper images of TTC staining from fibrin (left) and blood clot (right) animals demonstrate the similarity of sulcal clot volumes (arrows) between the groups. (D) Raster plots show the timing of individual spreading depolarizations for each animal in Cohort 1 (fresh blood), Cohort 2 (blood clot), and randomized control groups.

