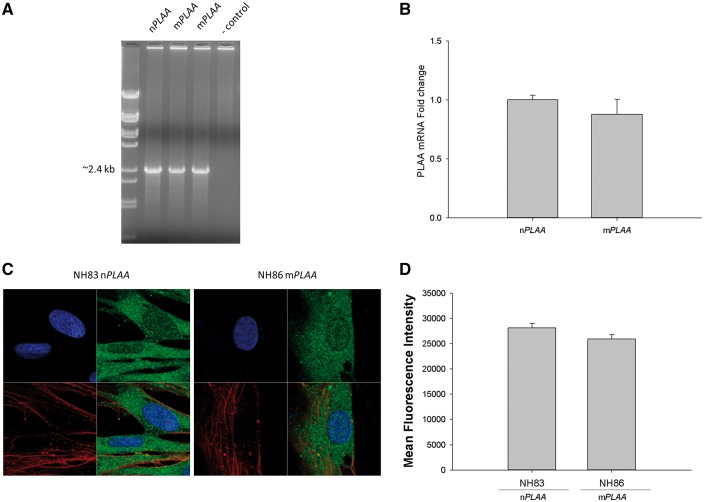
Figure 3.
mRNA levels for PLAA and confocal microscopy of fibroblasts for the presence of PLAA protein. (A) Presence of full-length transcript for PLAA from fibroblasts of affected patients and the control subject based on PCR. (B) RT-qPCR for the detection of PLAA transcript from fibroblasts of a patient versus the healthy control normalized to four house-keeping genes coding for human 18 S RNA, GAPDH, POLB, and L19 ribosomal protein. Arithmetic means ± SD from three biological replicates performed in triplicate are shown. (C) Fibroblasts (nPLAA or mPLAA) were counterstained with DAPI (blue) for the nucleus and with fluorophore conjugated phalloidin (red) for actin. Cells were fixed, subjected to immunofluorescence staining for PLAA (green), and observed by confocal microscopy. (D) Mean fluorescence intensity of regions of interest corresponding to the cytoplasm and nucleus of imaged cells (ImageJ processing software, NIH). Figure represents results from three sets of images and error bars represent SD.

