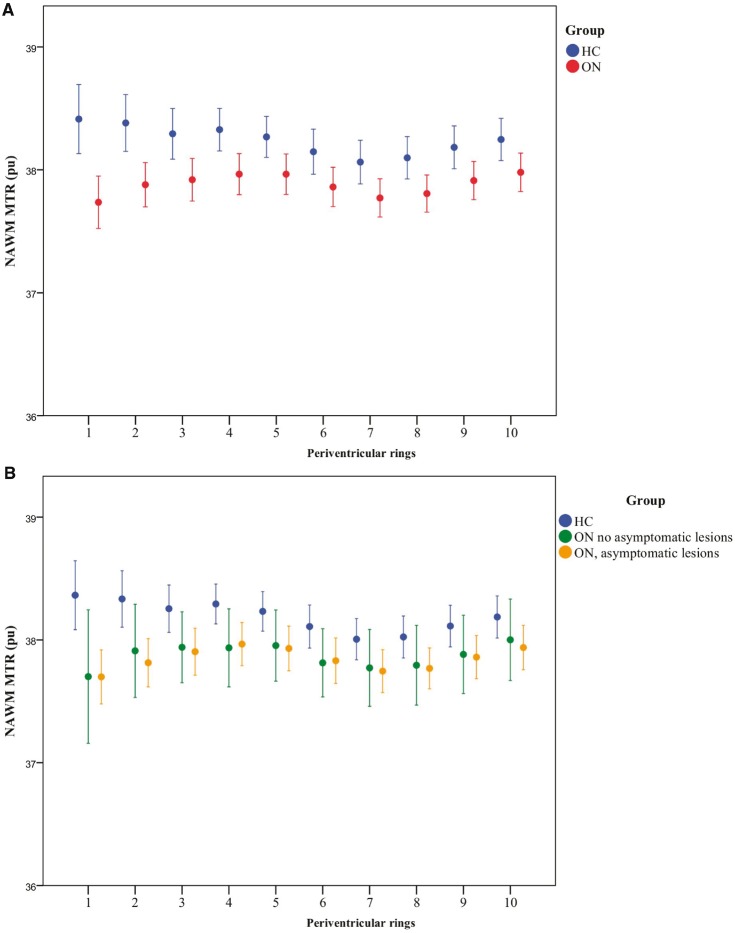
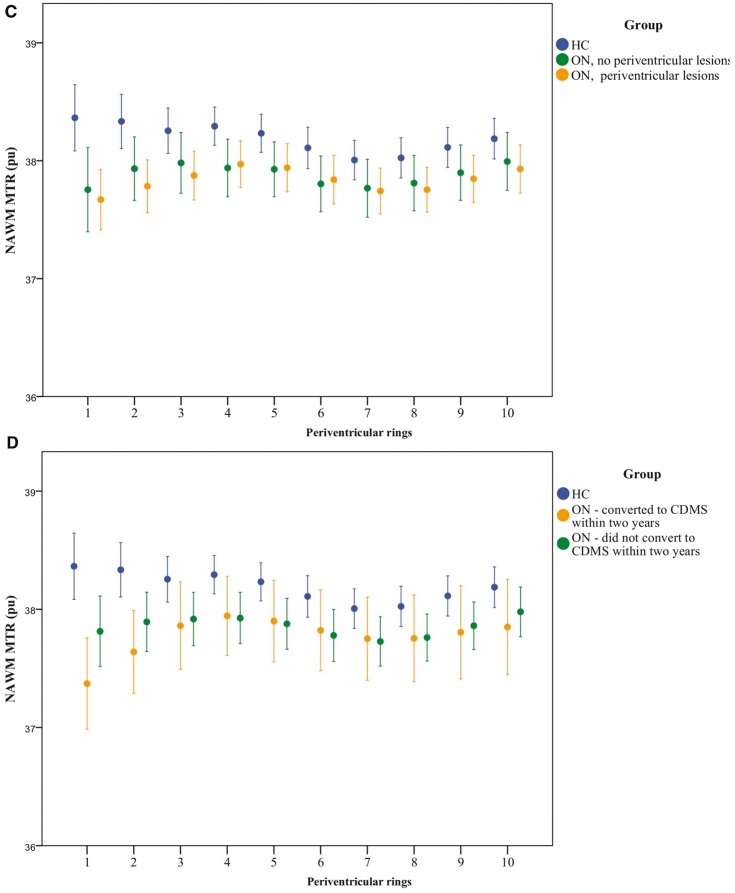
Figure 2.
Periventricular NAWM MTR in healthy control and optic neuritis groups. (A) NAWM MTR of rings in healthy controls (HC, blue) and patients with optic neuritis 4.6 months after symptom onset (ON, red). Mean ± 2 SE. MTR is expressed as percentage units (pu). Ring 1 is closest to the ventricular surface. (B) NAWM MTR in healthy controls (HC, blue) and patients with optic neuritis 4.6 months after symptom onset (ON), divided into those with (yellow) and without (green) asymptomatic lesions on their baseline scan. Mean ± 2 SE is shown. MTR is expressed as percentage units (pu). Ring 1 is closest to the ventricular surface. (C) NAWM MTR in patients with optic neuritis 4.6 months after symptom onset (ON) plus asymptomatic lesions, divided into those with (n = 46, yellow circles) and without (n = 9, green circles) periventricular lesions. Mean ± 2 SE. MTR is expressed as percentage units (pu). Ring 1 is closest to the ventricular surface. (D) NAWM MTR in healthy controls (HC, blue) and patients with optic neuritis 4.6 months after symptom onset (ON), divided into those who did convert to CDMS within 2 years (yellow) and those that did not (green). Mean ± 2 SE is shown. MTR is expressed as percentage units (pu). Ring 1 is closest to the ventricular surface.


