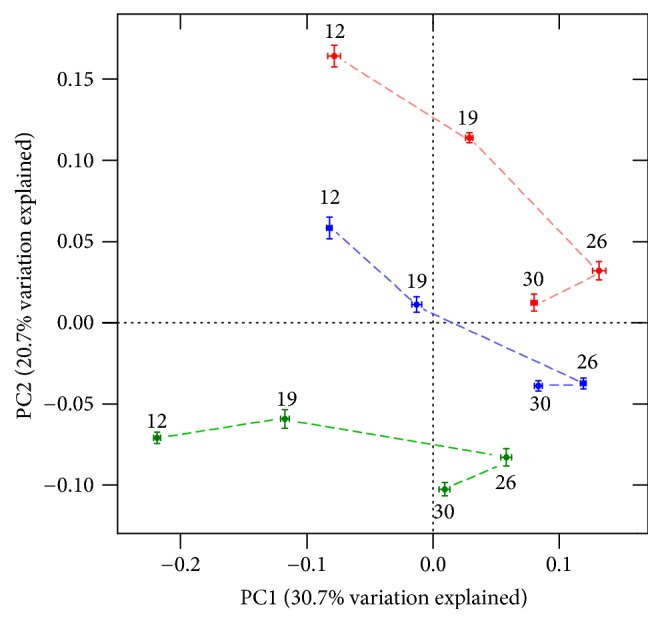
Figure 3.

PCoA plot based on unweighted UniFrac metric. Each color represents a different dietary treatment (blue: control without additives; red: bacitracin; green: tannins). Numbers by each point indicate the age of sampling in days. Axes (PC1 = 30.7% and PC2 = 20.7%) account for 51.4% of total variation observed. Bars indicate SD.
