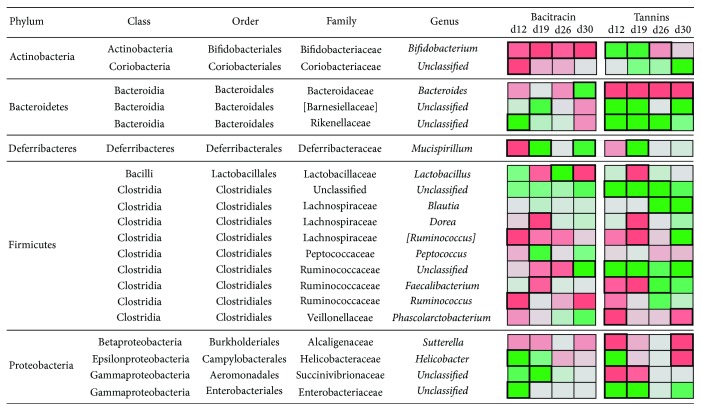
Figure 5.
Effects of tannins and bacitracin in the relative abundance of different bacterial groups of cecal microbiota over time. The heatmap in the right depicts the changes in the relative abundance of each of the taxa with respect to that observed in the control group (green: increased abundance; red: decreased abundance). Cells boxed with thick lines indicate statistically significant changes detected with STAMP.

