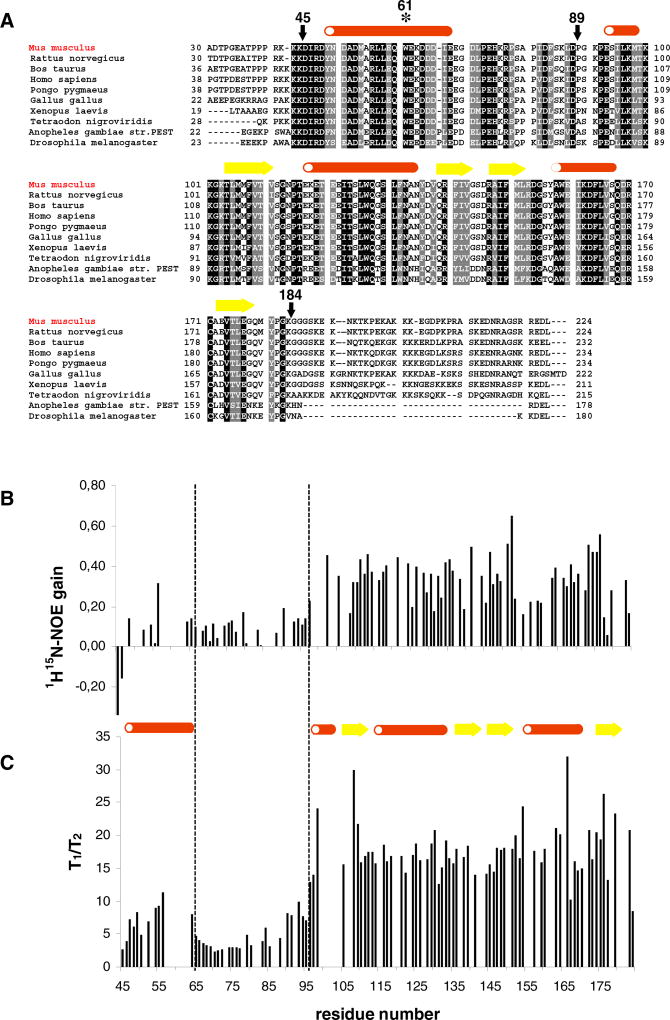
Figure 1. The Conserved Core Region of MESD Is Characterized by Strongly Changing Flexibilities.
(A) Sequence alignment of ten MESD homologs from mouse (NCBI-ID: Q9ERE7), rat (Q5U2R7), cow (Q3T0U1), human (Q14696), orangutan (Q5R6F1), chicken (Q5ZKK4), African clawed frog (Q4V7K5), puffer fish (Q4STS2), mosquito (Q7Q9R4), and Drosophila fly (Q9V4N7): black, identity; gray, similarity. The secondary structural elements are mapped to the mouse sequence; after every ten residues of the mouse MESD sequence, a space is included. Arrows mark the MESD truncations used for NMR structural studies. The asterisk shows the location of the W61R mutation. Interestingly, the homolog from chicken does not contain the characteristic C-terminal ER retention signal (REDL).
(B) The signal gain due to the heteronuclear 1H-15N-NOE, given as the ratio of the signal intensities of a 1H-15N-NOE spectrum and a reference spectrum without NOE transfer, is associated with the residue number. A low signal gain reflects high flexibility. (C) The ratio of T1 and T2 relaxation rate is associated with the residue number. A low T1/T2 ratio illustrates high flexibility. The dashed lines mark the domain boundaries.

