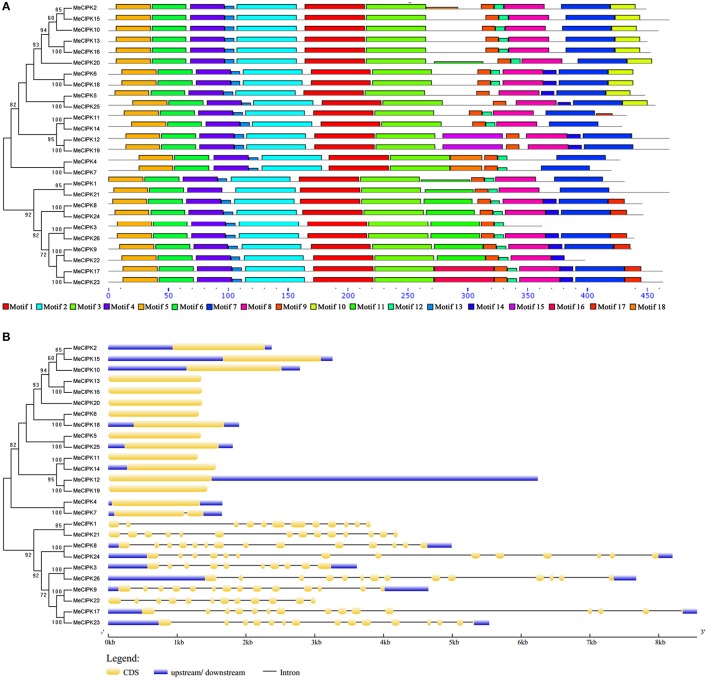
Figure 4.
Conserved motifs (A) and gene structures (B) of cassava CIPK genes. (A) The conserved motifs were using the MEME program and arranged corresponding to the phylogenetic tree. Different motifs are highlighted with different color boxes. The length of boxes corresponded to motif length. (B) The gene structures were drawn using the GSDS program and arranged corresponding to the phylogenetic tree. The yellow boxes represent exons, the blue boxes represent upstream and downstream UTRs and the lines represent introns.

