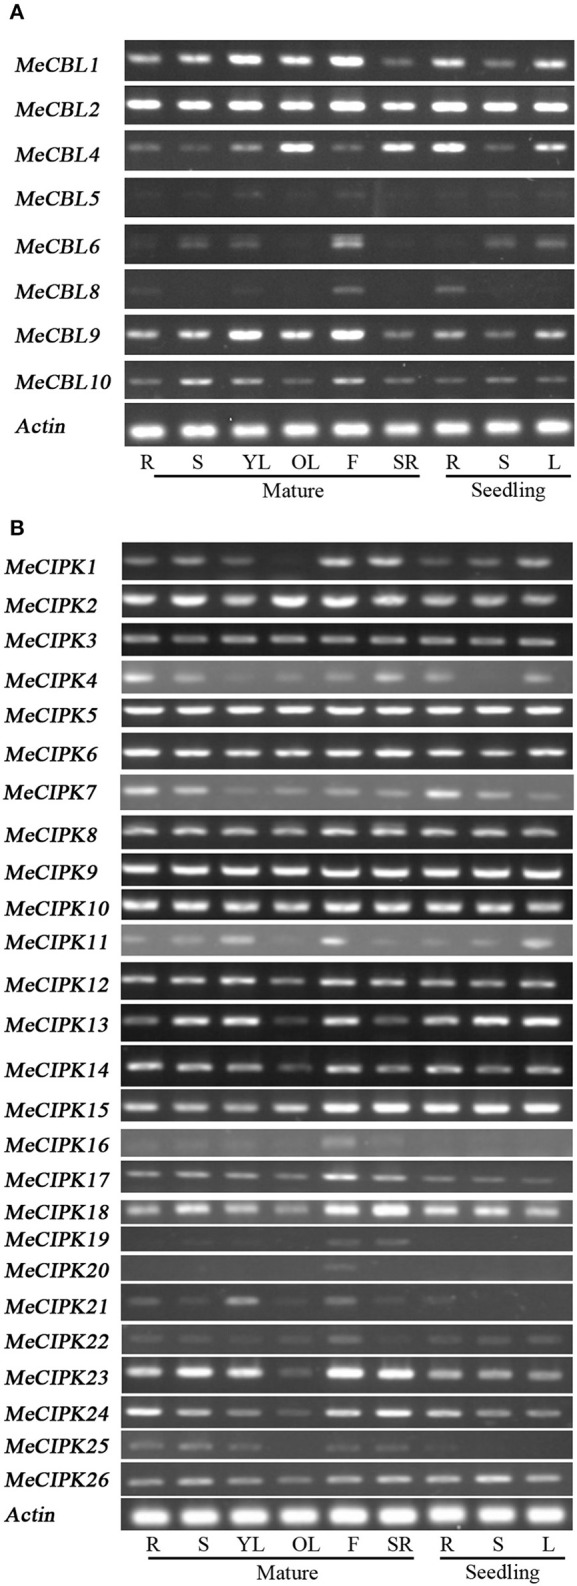
Figure 5.

Expression profile analyses of MeCBL (A) and MeCIPK (B) genes in cassava tissues using the RT-PCR method. “R” represents roots from mature plants or seedlings, “S” represents stems from mature plants or seedlings, “YL” and “OL” represent young leaves and old leaves of mature plants, respectively, “F” represents flowers, “SR” represents storage roots, and “L” represents the seedlings leaves.
