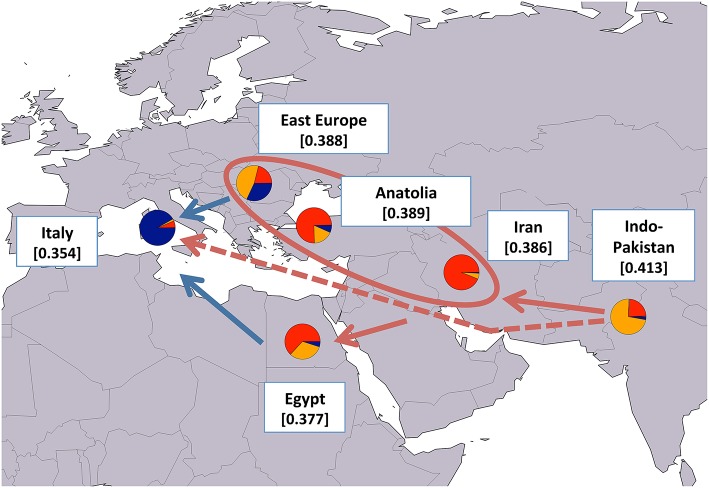
Figure 6.
Map showing average expected heterozygosity values calculated after grouping river buffalo populations according to the geographical area of origin: “east Europe” = RIVPH_BU_MUR and RIVRO; “Indo-Pakistan” = RIVPH_IN_MUR, RIVPK_AZK, RIVPK_KUN, and RIVPK_NIL; “Iran” = RIVIR_AZA, RIVIR_KHU, and RIVIR_MAZ. Populations from Anatolia, Egypt, and Italy were considered as separate entities. For each area the average membership coefficients corresponding to the results of ADMIXTURE software at K = 6 are also shown. The solid arrows (blue and red) indicate the direction of significant decreases in expected heterozygosity between adjacent areas (sensu Skrbinšek et al., 2012. See Supplementary Materials for further details), while the oval encloses areas for which differences in heterozygosity were not significant. Red arrows, in particular, correspond to the most likely post-domestication migration routes according to the joint evidence derived from (i) the present study, (ii) previous molecular-based research, and (iii) historical-archeological sources. The dashed arrow indicates an early and independent migration route that might have led river buffaloes into Europe. Underlying map from the GSHHG database, ftp://ftp.soest.hawaii.edu/gshhg.

